
 Bitcoin
 Ondo
Ondo NEAR Protocol
 Walrus
 Pearl
Pearl Pons
Pons Ethereum
- The TIA coin price has experienced an 8.76% decrease during the weekly trading session.
- The technical indicators summary suggests a sell signal in the current session.
Celestia (TIA) is the first modular blockchain network that decouples execution from consensus. The network enables anyone to easily deploy their blockchain with minimal overhead by introducing a new primitive, data availability sampling. Celestia unlocks new possibilities for the developers. It does not impose any execution or settlement constraints, allowing developers to define their executions.
TIA Coin Price has Delivered 550% in the Last Six Months
The TIA coin price has experienced an increase of 550% in its value since the initial token offering (ITO). The price has traded in a positive sentiment till now by forming highs and higher-low swings. It created a decisional demand level of $9.839.
Consequently, that demand level got a strong bullish response on January 3, 2024. Afterward, the TIA coin price surged over 100% from the $9.839 level. It made that level a solid bullish point of interest for future upline.
Alternatively, the price made a resistance at the $20.494 level, which lately got swiped by a green inverted hammer candle. The candle formed on February 10, 2024, and the TIA coin price has been moving downward since then.
The TIA coin price is performing 19.05% below its all-time high level. The 24-hour trading volume has decreased by 33.15% and is ranked 85th out of 8839 active cryptocurrencies. The current market capitalization stands at $2.82 Billion.
Technical Analysis of the TIA Coin
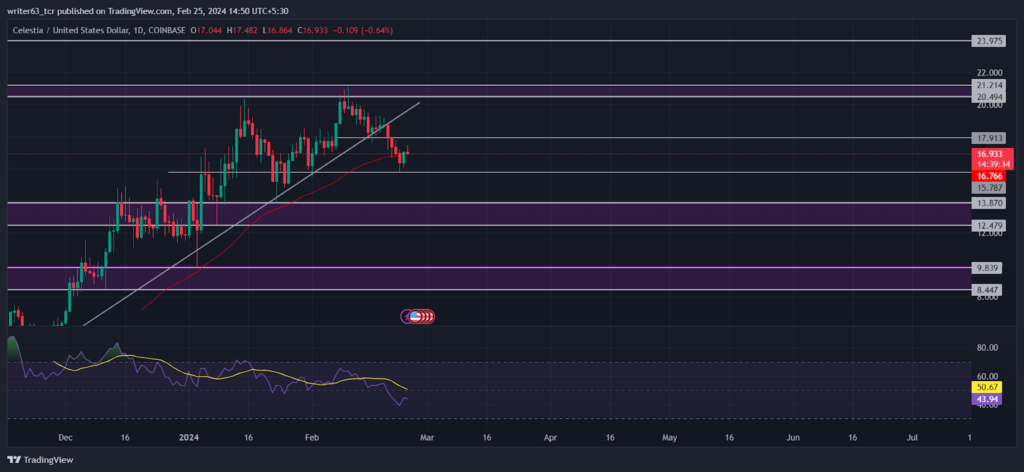
The current price of the TIA coin is struggling to maintain sustainability above the 50-day EMA. However, the price is still moving in an uptrend by forming swing highs. The 50-day EMA is moving at the $16.766 level, slightly below the current price.
The TIA coin price has given a breakdown at $17.913 from a trendline forming below. The current price seems like it is making a pullback toward the breakdown level. However, If the price rebounds by the trendline, it may continue the existing trend.
Conversely, if the price successfully retests the breakdown level, it may fall on the $13.870 support level. The other critical support level is at $9.839.
Furthermore, the relative strength index (RSI) reflects a bearish divergence in the momentum. It could be a false indication of bearish sentiments. The RSI is sloping at 44.68 below the 50-mark middle band.
Conclusion
The TIA coin price has been performing in an uptrend since the initial token offering (ITO). Recently, the price gave a breakdown from a trendline forming above. The current price is moving toward the breakdown level at $17.913. If it made a bearish correction on that level, the price may fall to the $13.870 level. However, the price should rebound by that trendline for the continuation of the trend.
Technical Levels
- Resistance levels: $21.214 and $23.975
- Support Levels: $13.870 and $9.839
Disclaimer
The views and opinions stated by the author, or any people named in this article, are for informational purposes only. They do not establish financial, investment, or other advice. Investing in or trading stocks and crypto comes with a risk of financial loss.




