
 Pearl
Pearl ZKsync
 Bitcoin
 Starknet
 Quantus
 Puffer
 Lighter
- The price of the Mantra crypto is trading above the 200-day SMA.
- OM crypto has shown 16 green days in the last 30 days.
MANTRA is an ERC-20 token powering MANTRA DAO, a decentralized autonomous organization (DAO) focused on staking, lending, and governance within the DeFi space. Created by John Patrick Mullin, it offers multi-purpose utility, including staking for rewards, governance participation, lending, borrowing, and ecosystem incentives, fostering community engagement.
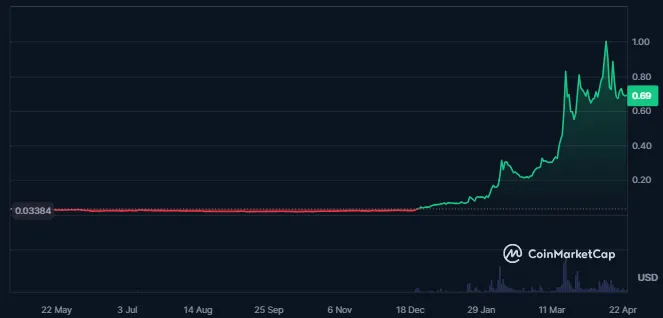
The Mantra crypto’s market cap has declined by 3.12% to $550.102M, and its market cap ranking is #129, according to CoinMarketcap. The trading volume of the crypto has further declined by 51.09% in the last 24 hours.
The value of the traded volume for the Mantra crypto is $21.765M, and the crypto’s volume/market cap ratio is 4.02%. Additionally, it has a circulating supply of 793.991M OM along with a total supply of 888.88M OM.
The fully diluted market cap of the Mantra crypto is $619.553Mand its market cap dominance is 0.01%. Additionally, the volatility of the crypto is 11.39%, which is considered high as per CoinCodex.
The total value locked of the Mantra is $909K, which further results in a market cap/TVL ratio of 610.6965. The crypto further has a liquidity of $3.75M, and the staked amount by the crypto is 7.38% of its market cap.
Mantra Crypto Derivatives Analysis
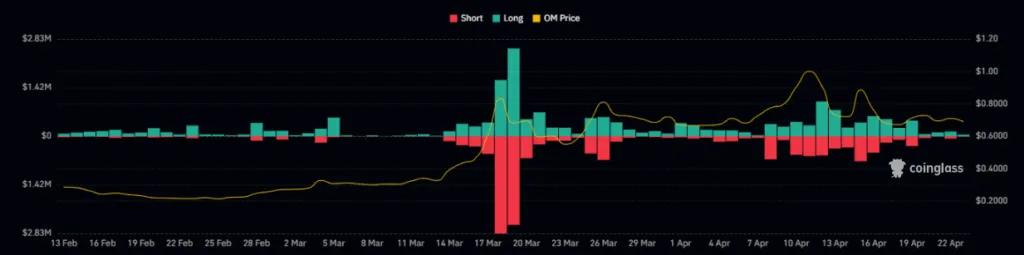
In the last 24 hours, OM crypto has witnessed a higher long liquidation of $96.06 K, representing sellers’ dominance in the market. Moreover, the short liquidation for the crypto is $21.95K.
The derivatives trading volume of the crypto has declined by 33.04% to $139.59M, and the open interest has advanced by 10.64%. Additionally, the long/short ratio of the crypto is 0.9826.
OM Crypto Technical Analysis
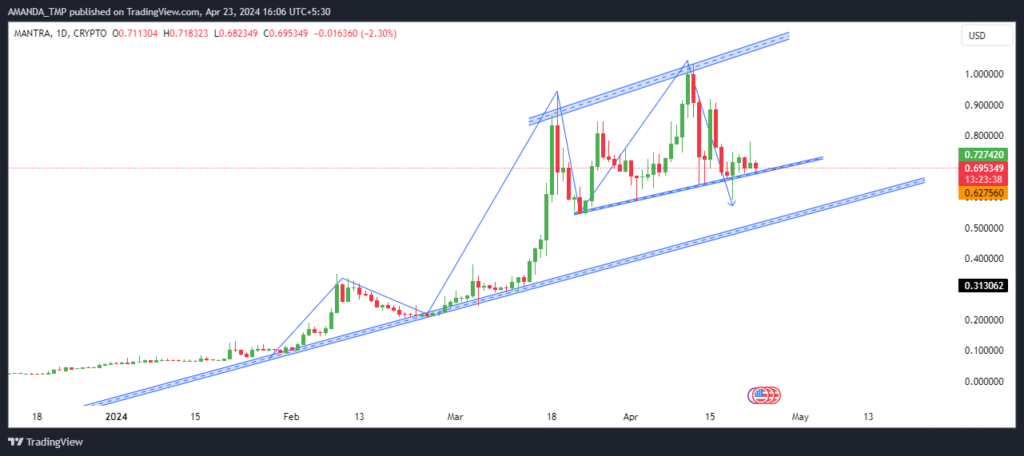
The OM crypto price trades inside a rising wedge pattern and forms bearish candlesticks on the chart. If the crypto price further breaks below the rising wedge pattern, it might take support at the lower dynamic trendline.
Thus, the OM crypto price has multiple support levels where the price might pause and reverse to the higher levels.
OM/USD Chart by TradingView
The OM crypto price has declined below the 20-day EMA while trading above the 50-day and the 200-day EMA. The following EMAs are further trading in a golden cross, exhibiting a bullish trend for the longer term.
The MACD and the signal lines are trading in a bearish cross, and the following metrics are consistently declining. Despite this, the given factors are trading above the zero level on the daily timeframe.
The RSI has slipped below the 14-day SMA and is currently taking support at the 50-level on the daily chart. If the RSI further bounces back above the 14-day SMA, the crypto price might be bullish.
Summary
The Mantra crypto, fueling MANTRA DAO for DeFi activities, faces uncertain price dynamics. Its market cap has slightly declined despite trading above the 200-day SMA and exhibiting several green days recently. While showing high volatility, OM’s technical indicators present mixed signals, suggesting potential fluctuations in its price trajectory.
Technical Levels:
- Support Levels: $0.10 and $0.3510
- Resistance Levels: $1.033 and $1.50
Disclaimer
This article is for informational purposes only and does not provide any financial, investment, or other advice. The author or any people mentioned in this article are not responsible for any financial loss that may occur from investing in or trading. Please do your research before making any financial decisions.




