
 Bitcoin
 Ondo
Ondo Pudgy Penguins
 Walrus
 Pons
Pons Quantus
 NEAR Protocol
- The BTC cryptocurrency price has decreased 4.69% during the weekly trading session.
- Technical indicators summary suggests a bearish signal in the current phase.
- A decrease of 48.59% has been observed in the Bitcoin price in the last 24 hours.
Bitcoin (BTC) is an open-source, decentralized cryptocurrency launched in January 2009. The blockchain offers direct online payments from one party to another without the need for any third-party financial institutions. Bitcoin price has shown tremendous growth since February 2024.
The crypto delivered over 65% positive profitability till March 2024. However, a correction phase occurred in April 2024, resulting in over 14% decline in price. The buyers are facing a challenging phase in the current month.
Bitcoin Price Performs Uncertainly at the Decisional Zone
The BTC crypto price experiences a bullish correction period at the current phase. The current price is trading at $61002.00 at a significant decisional point of interest (POI). Conversely, Crypto showed some signs of recovery in recent sessions, but the buyers failed to push the price above.
At present, Bitcoin has outperformed the global cryptocurrency market by 0.20%. In terms of market cap, the crypto needs no introduction. It holds the number-one spot in domination with a market cap of $1.20 Trillion. The community behind this particular cryptocurrency is 75% bullish today.
Price to Volatility & Social Dominance Analysis
The social dominance of Bitcoin crypto has an average coverage of 25% across the social platforms. The cryptocurrency doesn’t need any social buzz to be recognized. The price, on the other side, has been performing with bullish sentiments since that uprise. At present, social sentiments seem rising, which could be a positive signal.
Technical Analysis of the Bitcoin (BTC/USD)
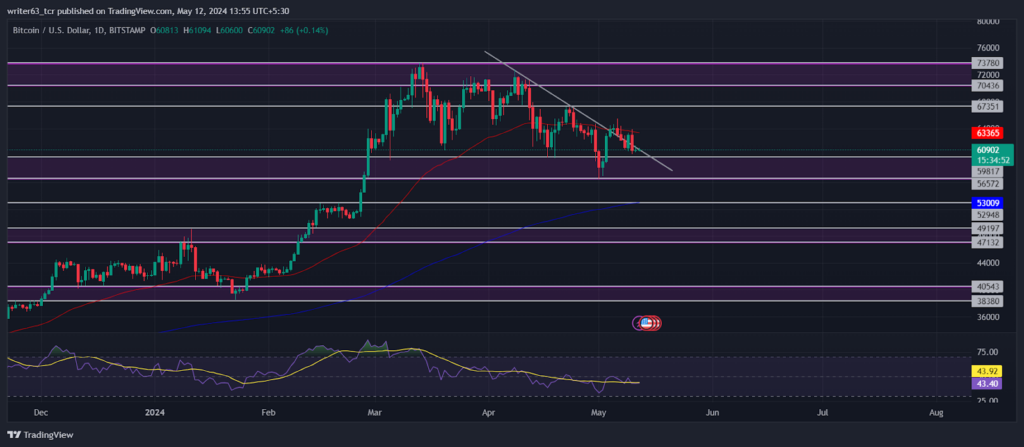
The long-term outlook for the BTC price movement is bullish, as per the current statistics. The price slipped between the 50-day and the 200-day EMAs, reflecting an uncertain short-term trend.
BTC price faced resistance from the $73780.00 level and experienced a bullish correction period. The price slipped below the $59817.00 key level and made a U-turn, but buyers failed to maintain buying pressure. Currently, the price is slowly declining, and there are more possibilities of being bearish than bullish.
Furthermore, the relative strength index (RSI) has shown a strong bullish momentum in the current phase. The RSI and SMA lines are getting close together, indicating a lack of strength.
Summary
Since March 15, 2024, Bitcoin price has been experiencing bearish sentiments. The crypto six-month positive returns have dropped to 67.38%. However, BTC has shown strong bullish candles formation from the $56572.00 support level, which can lead the price to a potential bullish continuation.’
Technical Levels
At the time of writing, the immediate support for BTC was $56572.00, while the $67351.00 level is the next resistance. A price rise can be seen if the price exceeds the upper resistance level. Likewise, a fall below the mentioned support level can lead to a price pullback to the next support level.
Disclaimer
The views and opinions stated by the author or any people named in this article are for informational purposes only. They do not establish financial, investment, or any other advice. Investing in or trading crypto or stock comes with a risk of financial loss.




