
 Doge Pepe
 Bitway
 Pons
Pons Sui
Sui Pearl
Pearl Ronin
Ronin Zcash
Zcash
- At the beginning of the third week of May, the SOL price hit a high of $188.41.
- The trading volume for the crypto has declined by 10% over the last 24 hours.
Solana is a high-performance blockchain that uses proof-of-history (PoH) and delegated proof-of-stake (dPoS) to handle thousands of transactions per second.
Its native SOL token is used to pay transaction fees, interact with smart contracts, and can be staked for rewards.
What is Happening in the Solana Environment?
PayPal’s cryptocurrency, PYUSD, has been integrated with the Solana blockchain, as announced at the Consensus 2024 event. This integration marks a significant development for Solana, leading to a surge in its crypto price.
Despite this positive development, Solana enthusiasts faced a setback with recent news from an article published by “Bitcoin.com.” According to JP Morgan, the SEC is unlikely to approve ETFs for several cryptocurrencies, including Solana and XRP.
While the integration with PYUSD is a testament to Solana’s robust infrastructure and potential for mainstream adoption, the uncertainty surrounding ETF approvals highlights the ongoing regulatory challenges the cryptocurrency sector must navigate.
How are the Technical Factors of the SOL Crypto Acting?
The Solana crypto’s market cap has witnessed a decline of 3.7% in the last 24 hours. It led to a market cap value of $2.859B and a market cap ranking of #5.
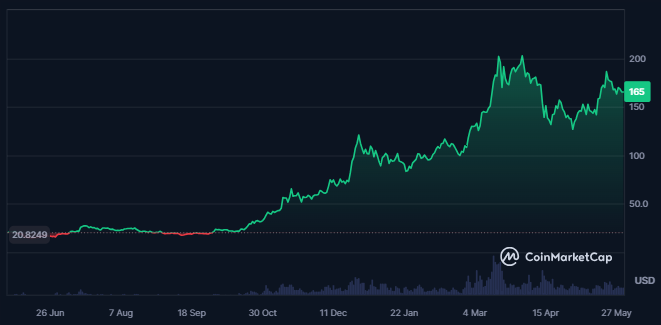
The Coincodex shows the crypto sentiment to be bullish while the price volatility of the SOL crypto is high, resulting in 9.56%.
Solana has a strong market presence, with a market cap dominance of 2.91%. Also, 3.62% of the market cap of the crypto was traded within 24 hours from press time.
What does the Technical Chart Show in SOL Crypto?
The overall trend of the SOL crypto looks positive on the daily chart, followed by several support points and a dynamic trendline on the lower side.
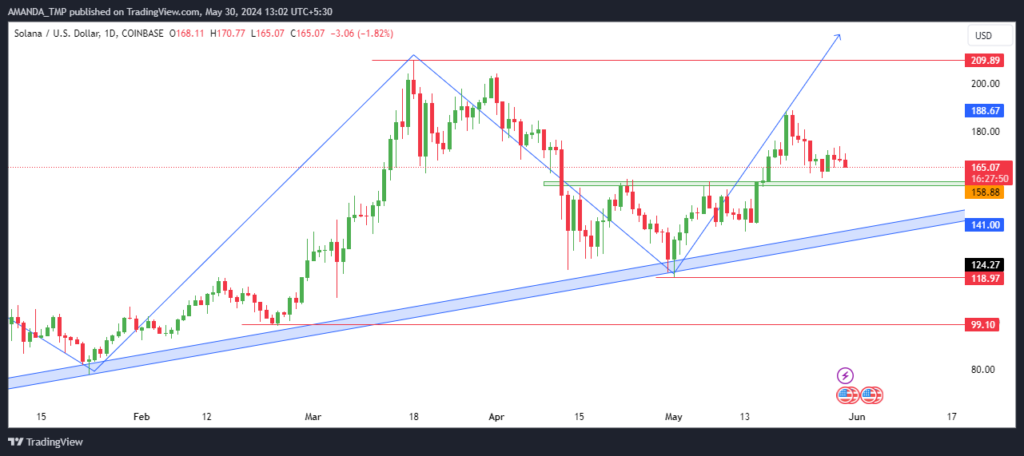
The crypto price has further broken above a crucial resistance and is currently sustaining above the same. Although the most recent price action shows profit booking in crypto, a further surge to higher levels in crypto might be seen if the most recent swing high is taken out.
SOL/USD Chart by TradingView
The technical indicators on the daily chart of the SOL crypto further showed strength in the trading price of the crypto.
The 50-day and the 200-day EMAs are trading in a golden crossover, and the price has also advanced above the following EMAs.
Despite this, the MACD showed uncertainty in the price as its metrics overlap each other.
The RSI, on the other hand, has sustained above the 50 level and is currently trading below the 14-day SMA. That shows temporary volatility in the price of the crypto.
Summary
Solana’s integration with PayPal’s PYUSD led to a price surge to $185. Despite bullish sentiment and strong technical indicators, including a golden cross and RSI above 50, the SEC’s likely rejection of Solana ETFs introduces uncertainty. The market cap declined by 3.7%, and trading volume dropped by 10%.
The support levels for the SOL crypto on the lower side are $119.0 and $141.0, followed by resistance levels of $210.0 and $225.0.
Disclaimer
This article is for informational purposes only and does not provide any financial, investment, or other advice. The author or any people mentioned in this article are not responsible for any financial loss that may occur from investing in or trading. Please do your research before making any financial decisions.




