
 Pearl
Pearl Bitway
 Monad
Monad Ondo
Ondo Derive
 Walrus
 Zcash
Zcash
- PEPE crypto has been a weekly top gainer, with an increase of 49.8%.
- PEPE crypto’s price is trading close to its cycle high.
Pepe (PEPE) is a meme coin inspired by the internet meme Pepe, with no intrinsic value or financial expectations. It is community-focused, with its liquidity provider tokens burned and contracts renounced.
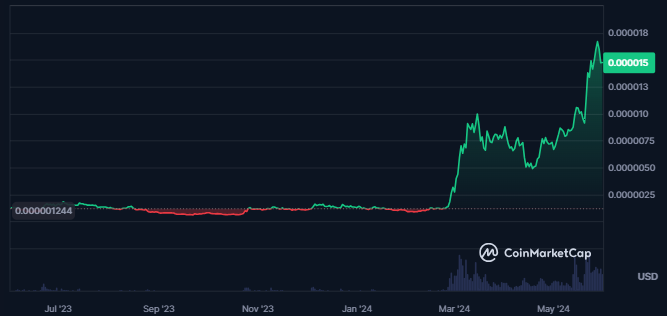
A renowned source on PEPE crypto stated that a whale investor made a profit of $4.95M within a month.
The PEPE crypto price has further witnessed a surge of 1100% in the last 1 year. The current market cap value of the crypto is $6.242B at the time of writing.
The top 10 crypto holders have 45.85% of the PEPE, and a total of 420.689T PEPE are circulating in the global crypto market. Its fully diluted market cap is $6.239B.
The liquidity of the crypto is very high, resulting in a 30.9% volume/market cap ratio. Also, PEPE is the 21st largest cryptocurrency in the global crypto market, with a market cap dominance of 0.25%.
PEPE Crypto Derivatives Analysis
The long liquidation recorded for the PEPE crypto is $2.04M, whereas the short liquidation is worth $1.21M. It shows profit booking in the crypto over the last 24 hours from the press time.
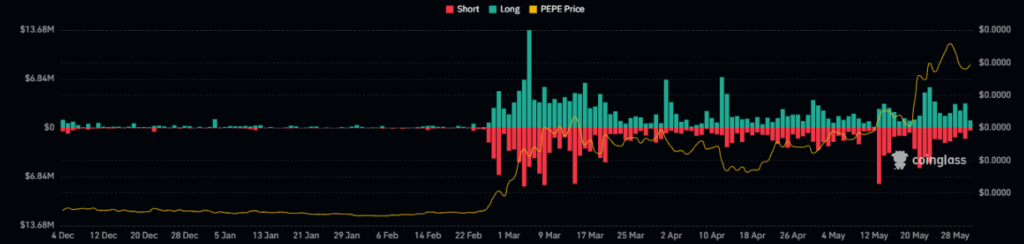
If we look at the overall PEPE crypto chart, higher short liquidations can be seen, which shows an uptrend in the price.
The derivatives traded volume value of the crypto is $1.27B traded over the last 24 hours. The open interest in the crypto has also advanced by 2.1%, resulting in a value of $161.96M.
PEPE Crypto Technical Analysis
On the daily chart, the PEPE crypto price follows a strong uptrend, followed by the formation of a higher high swing.
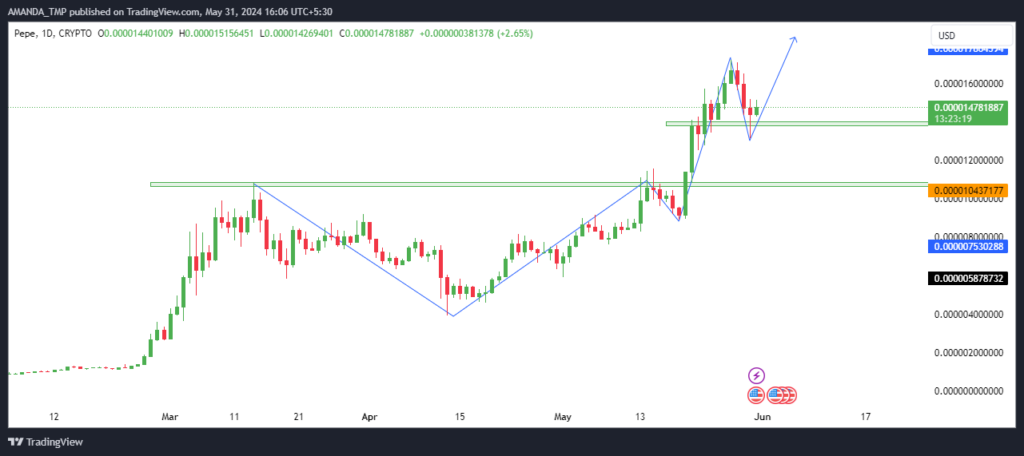
The PEPE crypto price has broken above crucial swing highs and structure levels. It shows a strong dominance of bulls in the crypto price. The price has also declined by 20% from its all-time high and is currently taking support at its CMP.
If the price breaks above the most recent swing high, a strong bullish momentum might be seen in the future.
PEPE/USD Chart by TradingView
The price of the PEPE crypto has advanced by 40% from the 50-day EMA on the daily chart, which is a considerable deviation.
The 50-day and the 200-day EMAs on the daily chart of the PEPE crypto are trading in a golden crossover.
The MACD is bullish on the chart, followed by its metrics trading in the bullish trajectory in a bullish crossover.
The RSI has also hit the overbought zones and is trading at a level of 63.75 at press time. It shows strong momentum in the crypto’s price.
Summary
Pepe (PEPE) has surged by 64% from its last swing low, reaching new highs. With a market cap of $6.242B, PEPE has seen an 1100% increase in the past year.
Technical indicators like a golden crossover and bullish MACD signal a strong uptrend. The top holders possess 45.85% of the supply, indicating significant investor interest and bullish momentum.
The support levels for the PEPE crypto are $0.00000890 and $0.00001320, while its resistance levels are 0.0000170 and 0.00020.
Disclaimer
This article is for informational purposes only and does not provide any financial, investment, or other advice. The author or any people mentioned in this article are not responsible for any financial loss that may occur from investing in or trading. Please do your research before making any financial decisions.




