
 Bitcoin
 Ondo
Ondo Pudgy Penguins
 Walrus
 Pons
Pons Quantus
 NEAR Protocol
- The Akash Network token price has outperformed 95% of the top 100 crypto assets in the last 1 year.
- In the last 30 days, the token’s price has traded in green for 14 days.
The price of the AKT token is highly volatile, resulting in a volatility of 8.36%. This shows the higher possibility of uncertain fluctuations in the crypto price.
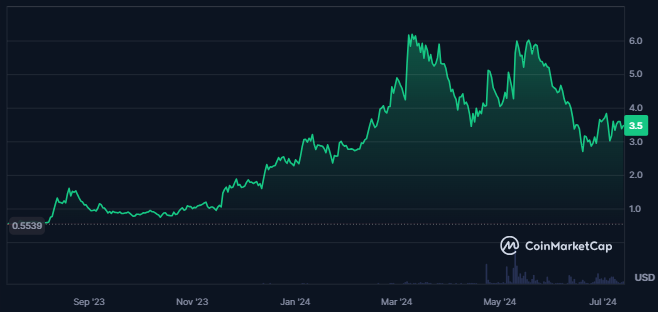
Price Overview Chart of AKT | Source: CoinMarketCap
The fully diluted market cap of the token has declined by 16% in the last 30 days, resulting in $1.30B. Additionally, the maximum supply of the token is 388.539M AKT, followed by a circulating supply of 244.067M AKT, which is 62.82% of the maximum supply.
The market cap of Akash Network token has advanced by 5.4% in the last 24 hours. Also, the market cap value of the token is $844.178M, which makes it the 73rd largest crypto in the global crypto market.
With the advance in the market cap, the value of the traded volume for the token has advanced by 50% in the last 24 hours. This further results in a traded value of $23.785M and shows an advance in the token’s trading volume.
The market cap dominance of the Akash Network token is 0.04%, which presents its strong market presence. Analysts say the token’s sentiment has been neutral, and the fear and greed index is at 25. This showed extreme fear among the investors for the crypto.
Akash Network Derivatives Data Analysis
Open interest for the token has advanced by 41% in the last 24 hours as of press time. This shows a surge in the number of open positions for the token, resulting in a value of $1.58M.
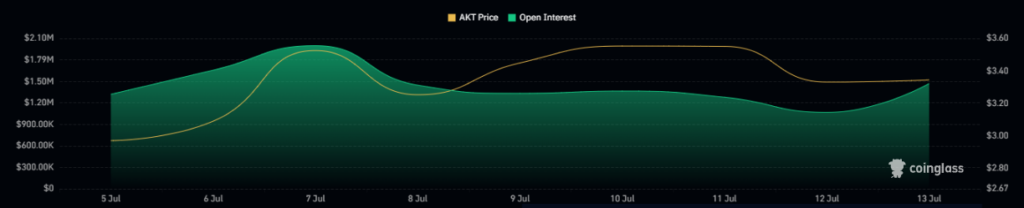
Akash Network Crypto Derivatives Liquidation Chart | Source: Coinglass
The open interest of the Akash Network has started to advance over the last few days. This shows a recent advance in the token’s trading volume and open interest.
The value of the derivatives traded volume for the token has advanced by 75% in the last 24 hours from the press time.
The recorded long liquidation for the token further has resulted in $185.0, while the shorts liquidated for the token were worth nil.
AKT Token Technical Analysis
When writing, the larger timeframe shows a bullish trend as the price of the AKT crypto followed a strong uptrend and a consistent surge in price for the last 1 year.
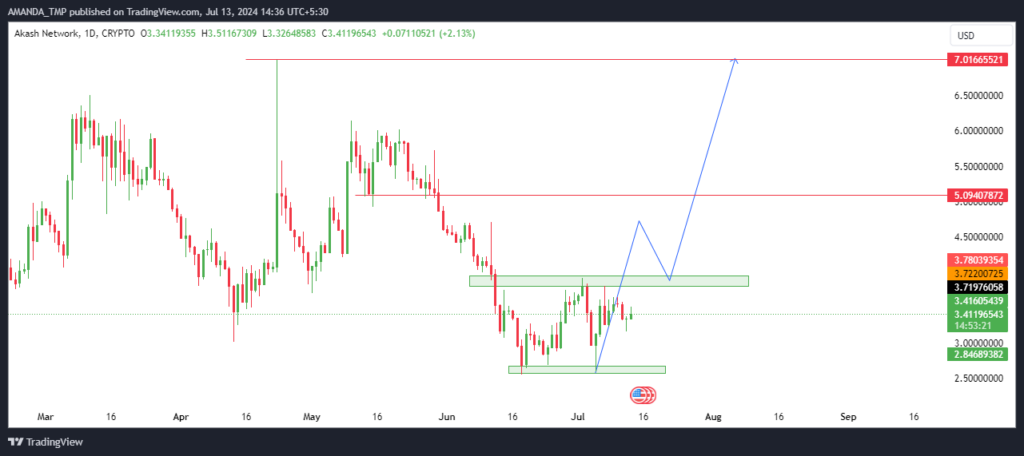
AKT Crypto Daily Price Chart | Source: TradingView
The AKT price witnessed profit booking from the higher levels, leading to the lower levels of $2.5. The price has taken support at the lower levels and has formed a double bottom.
If the crypto price further breaks above the level of $4.0 and closes above the same on the daily chart, we might see a further surge in the crypto price.
AKT/USD Chart by TradingView
The AKT crypto price was trading below the 200-day EMA at press time. However, a golden crossover had formed between the 50-day and 200-day EMAs, indicating the potential for a price reversal to higher levels shortly.
Meanwhile, the MACD metrics were in a negative trajectory, yet they had also formed a golden crossover and were advancing to higher levels. This suggests that the momentum may be shifting positively.
Additionally, the RSI had reached the 50 level and moved above the 14-day SMA. Should the RSI break further above the 50 level, it could signal a surge in the momentum of the AKT crypto.
All in All
The price of AKT crypto, trading below the 200-day EMA, shows potential for a reversal with a golden crossover.
Despite a positive shift in MACD and RSI indicators, the high volatility (8.36%) and extreme investor fear suggest uncertain fluctuations ahead. Watch for a break above $4.0 for future surges.
The price of AKT tokens might take support at the level of $2.10 and $2.60, followed by the resistance levels of $5.10 and $7.00.
Disclaimer
This article is for informational purposes only and does not provide any financial, investment, or other advice. The author or any people mentioned in this article are not responsible for any financial loss that may occur from investing in or trading. Please do your research before making any financial decisions.




