
 NEAR Protocol
 Pearl
Pearl Bitcoin
 Puffer
 ZKsync
 Pudgy Penguins
 Hyperliquid
- NEO surged 40% in the past 2 weeks, reflecting buyers’ comeback.
- NEO has broken out from a falling channel.
According to the chart structure, NEO declined through a descending channel. The price rose above the 20-day EMA. Buyers could likely push to the 200-day EMA.
Since October 2023, NEO has performed positively, but the bullish trend was disturbed near the $22 mark. The digital asset price has declined by 50% since mid-April.
At press time, the crypto was trading at $11.63, gaining 1.35% in the past 24 hours. The market capitalization was $821.74 Million, and the 24-hour trading volume was $41.97 Million.
Strong Buying Momentum After Breakout?
A source on X noted that NEO price picked up liquidity below a major support level and broke out from the trendline. The price may record a 52-week high if the investors show faith in the breakout.
$NEO pic.twitter.com/B3TweKfryA
— ERROR (@ER404i) July 17, 2024
Neo Price has Triggered a Breakout from Descending Channel; What’s Next?
On a daily time frame, the NEO crypto price has witnessed selling pressure for the past few months.
The bullish momentum was lost as the price declined through the trendline. The crypto broke out in mid-July, and is heading for the 200-day EMA.
If the digital asset price manages to defend the 20-day EMA, buyers might lift the price to the 200-day EMA. The breakout from the 200-day EMA might result in strong buying pressure.
On the other hand, if NEO trades below the 20-day EMA, it may reenter into the channel. If the price reenters the channel, it may fall through the channel.
Based on the technical indicators, RSI has displayed a bullish divergence and has recovered from the oversold zone. MACD has generated a golden crossover with the signal line, and the histograms have been flipped to green.
Technical Analysis of NEO on 4-H Timeframe
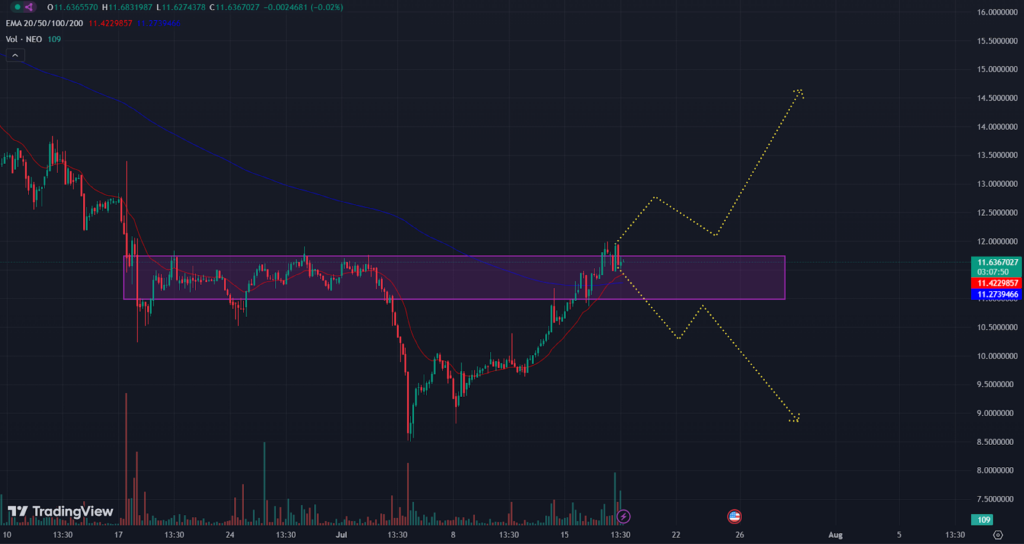
COINBASE: NEO/USD 4-H Chart | Source: TradingView
In a 4-H time frame, NEO had slipped below the parallel channel with strong selling pressure. However, buyers have shown interest and lifted back to the channel.
Buyers may dominate if it surpasses the parallel channel, and the price may gain bullish momentum. On the other hand, if the digital asset price slipped below the parallel channel, the price may perform negatively further.
Massive Surge Imminent After Breakout?
Considering the recent surge and the breakout from the descending channel, NEO is likely to reclaim the $20 mark.
The technical indicators such as RSI and MACD suggest a strong buying momentum. If the price manages to defend the 20-day EMA, it might head towards the 200-day EMA.
Monitoring the price closely is essential to see if it reenters the channel or surpasses the parallel channel in the 4-H timeframe.
The recent developments indicate a positive trend. However, market volatility and investor sentiment will play crucial roles in NEO’s future price movements.
NEO is expected to face resistance from the $11.60 and $14.30 levels. The token may take support at the $9.67 and $6.67 marks.
Disclaimer
This article is for informational purposes only and provides no financial, investment, or other advice. The author or any people mentioned in this article are not responsible for any financial loss that may occur from investing in or trading. Please do your research before making any financial decisions.




