
 Pearl
Pearl Bitway
 Pudgy Penguins
 Quantus
 Walrus
 Quant
Quant Artificial Superintelligence Alliance
- A falling channel was noted, and the BRETT price declined close to the channel lows.
- BRETT’s future Open Interest (OI) shed over 29.17% to $20.76 Million in the past 24 hours.
Over the past 24 hours, BRETT, the largest blockchain on the Base Blockchain, has severely declined. It was dragged over 16%, crashing the crucial 200-day EMA support zone.
BRETT was still down by 16% at press time, trading at $0.0883, reflecting the bearish sentiments. Its trading volume surged over 69%, revealing optimism among investors and traders.
Amidst the market bloodbath in the last 24 hours, most top cryptocurrencies and BRETT have participated in the selloff. The memecoin sector also saw a major drop, and the memecoin market cap fell to $39.33 Billion.
Most cryptocurrencies follow the movement of Bitcoin, especially the memecoin sector. If Bitcoin performs poorly, it will influence and alter investors’ sentiment and altcoin participants. Additionally, It will bring in negative feedback and influence selloff.
BRETT price action fell below the significant moving averages. This hinted at the sharp rejection from the channel’s upper trajectory near $0.1460. It made a four-day selloff streak, losing over 35% this week.
Still, the channel’s lowest trajectory was valid, which was placed near $0.08000. A next bearish leg could be seen toward $0.07200 if it breaks.
Notably, the lower low swing formation conveyed severe selling pressure from the top. The buyers stayed on the back foot.
Until the cluster of $0.1200 was not retained, the trend remained bearish. Also, a sell-on high structure could be seen ahead.
Since the top formation on June 9 at $0.194, BRETT continued to display profit booking moves. It extended the one-way correction, correcting over 54% till now.
BRETT Lost Momentum: Will It Dive Into The Downtrend?
BRETT’s daily chart setup conveyed the falling channel pattern, and lower lows were seen on the chart. Moreover, the BRETT price has dragged below the 200-day EMA mark, which signifies the severe selling pressure over the weekend.
It has maintained a losing streak this week, and no noteworthy pullbacks were seen. Sellers continued to dominate and have been eyeing to breach the channel’s lowest region of $0.08000.
BRETT Price Chart | Source: Santiment
The Momentum indicator (RSI) curve fell to the oversold region and guided sustained selling pressure throughout this week. Similarly, the MACD line dropped below the signal line, conveying the bearish stance.
@thecryptopatch, in his tweet, highlighted that BRETT has disclosed a wild move and is set for a breakdown.
$brett gone wild
— The Crypto Patch (@thecryptopatch) August 3, 2024
your $1,000 meme coin portfolio is now worth $20 pic.twitter.com/FnA5p3wEVQ
A Tweet by @thecryptopatchn | Source: X
Per the Fib retracement levels, the BRETT price corrected over 54% from the higher zone. It dropped to the 38.2% crucial support zone.
If the immediate channel lows of $0.0800 are breached, it may extend the decline. This could move toward the 23.6% support level near $0.07200.
What Do On-Chain Metrics Say?
The weighted sentiment data has sailed below the zero line, noted at the -0.717 mark. This replicated a negative stance among the investors.
Social Dominance Data | Source: Santiment
The Social Dominance data showed a negative stance, as a downtick was noted, and it dropped over 9% this week. This shift implied a drop in the chatter and discussions among investors on social media platforms.
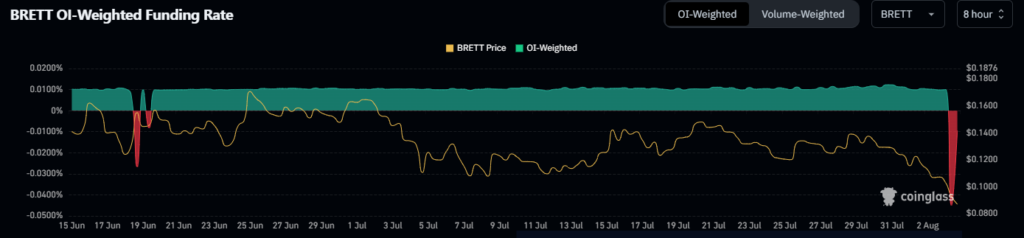
Funding Rate Noted a Sharp Downmove
The token’s funding rate was noted at -0.0448% at press time. Generally, a negative funding rate means sellers must pay the buyers, indicating a bearish market sentiment.
If BRETT’s price continues to drag, it may take support around the downside mark of $0.08300. This would be followed by $0.07700.
Conversely, if any pullback happens, the immediate resistance zone could be around $0.09300, followed by $0.1000.
Disclaimer
This article is for informational purposes only and does not provide any financial, investment, or other advice. The author or any people mentioned in this article are not responsible for any financial loss that may occur from investing in or trading. Please do your research before making any financial decisions.




