
 Doge Pepe
 Optimism
 Pearl
Pearl Quantus
 Bitway
 Pons
Pons NEAR Protocol
- The LINK token price has advanced by more than 30% since the most recent swing low.
- The Chainlink token price was highly volatile, resulting in a volatility of 11.24%.
The Chainlink token’s sentiment was bearish, per the analyses, following which the fear and greed index is also at 40. This showed fear among investors for LINK, while the price has advanced over the last four days.
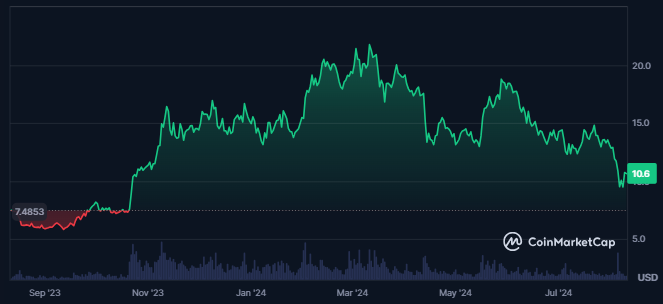
A decline in demand for Chainlink can be seen as the crypto’s traded volume value declined by 23.4% over the last 24 hours. The token’s market cap has slightly advanced by 0.95% at press time.
The liquidity is certainly low as its volume/market cap ratio was 3.13%, resulting in a traded value of $199.264 Million. Also, Chainlink had a very strong market presence, the 16th largest cryptocurrency in the global crypto market.
The token’s market cap dominance of the token was 0.29%, and supply inflation was certainly high, resulting in 9.11%.
While the token’s maximum supply was not defined, its circulating supply was 608.099M LINK. The token’s maximum supply was 1.0B LINK, further resulting in a fully diluted market cap of $10.634B.
Financial Data Overview Of Chainlink Token
The large holders’ concentration in Chainlink tokens was 69% when writing. The token’s price correlation with Bitcoin was 0.81.
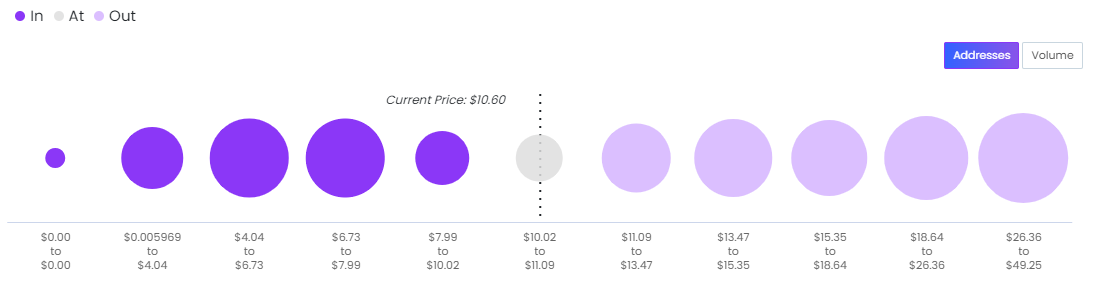
Chainlink had a total of 723K holders, of which 242.47K addresses are sitting in the money. It also means that their holdings are in profit. This showed that 24% of the holders are in profit while only 62% are at a loss.
LINK Token Technical Analysis
A strong lower-low pattern can be seen on the daily chart of the LINK token price. The LINK token price recently broke down below a crucial support zone.
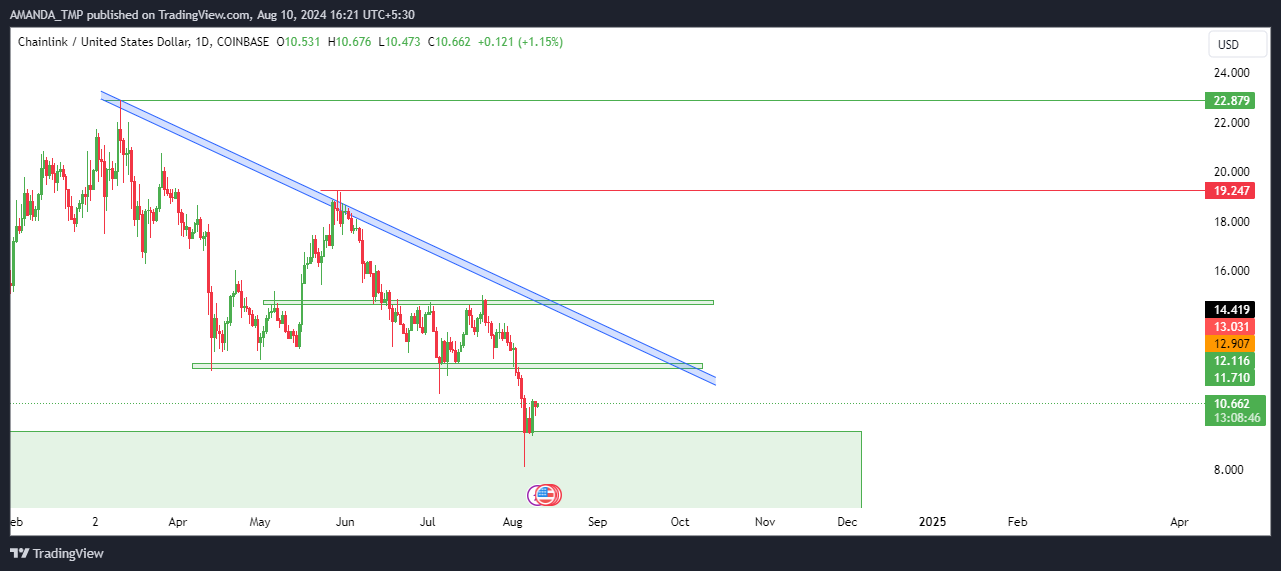
A descending triangle pattern was formed on the daily chart, followed by a dynamic resistance level.
About a year ago, the LINK token price traded in a consolidation zone for a long time. It further broke out above the consolidation and advanced to a higher level.
At press time, the LINK token price declined to the breakout level. Furthermore, we might see a strong uptrend if it forms a bullish pattern and breaks above the dynamic trendline.
Chainlink Price Technical Indicator Overview
Following the long price decline, the LINK token price declined below the average true range of the supertrend. It also traded below the 50-day and the 200-day EMAs for a long time.
Additionally, both the EMAs traded in a death cross from the last few weeks from the press time.
LINK/USD Chart by TradingView.com
The MACD and the signal line have traded in the negative trajectory for a long time following a death cross. This exhibited a strong dominance of sellers in token price.
The RSI hit the oversold zone a few days ago and overlapped the 14-day SMA. It showed volatility and uncertainty in the token price.
If the LINK token price continues to decline, it might take support at the level of $5.70 and $9.50. This would be followed by the resistance levels of $19.20 and $22.80.
Disclaimer
This article is for informational purposes only and does not provide any financial, investment, or other advice. The author or any people mentioned in this article are not responsible for any financial loss that may occur from investing in or trading. Please do your research before making any financial decisions.




