
 Puffer
 Bitcoin
 ZKsync
 NEAR Protocol
 Walrus
 Pearl
Pearl Ondo
Ondo
- BONK is on the verge of making history by potentially becoming the first meme currency to have an ETP.
- The BONK token shows signs of a potential bullish breakout from a descending wedge pattern.
Bonk (BONK) price has geared up to make waves in the crypto world. It intends to introduce an exchange-traded product (ETP) in the United States. The most recent Solana Breakpoint event revealed this news. The buzz is that Osprey Funds, based in New York, was working with this exciting effort.
Osprey Funds is no stranger to innovation. They are well-known for their part in the Solana Trust and for streaming one of the earliest exchange-traded funds (ETFs).
If successful, this might be the first meme currency ETP, with the BONK coin likely remaining the ticker. It is anticipated that the official launch will occur before the year’s end. Stay tuned, as there is anticipation that the BONK price might just skyrocket!
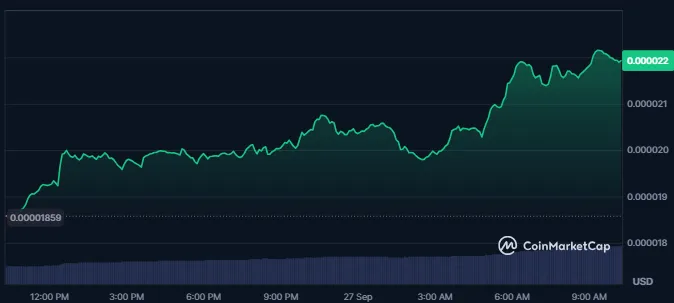
Optimism Surrounds BONK Price And Memecoin ETFs
Analysts are optimistic about future movements of the BONK price. They have predicted a potential 200% surge. The BONK/USDT pair recently touched a crucial support level three times. This echoed a pattern seen earlier this year that led to a 180% increase between April and May.
Additionally, long-term traders were showing growing confidence. This was reflected by a positive OI-weighted funding rate of 0.0006%.
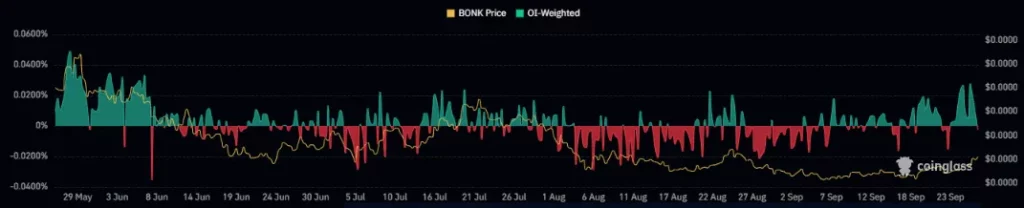
Despite their volatility, Bitwise’s Chief Investment Officer, Matt Hougan, believes this could usher in an “ETF era” for meme coins.
Shiba Inu’s marketing lead, Lucie, emphasized that a meme coin ETF could benefit traditional and institutional investors. It can simplify asset acquisition while improving security and compliance.
However, concerns remain. Edward is a BloFin Research analyst. He pointed out that institutions must consider regulatory hurdles before launching such products, particularly for volatile assets like SHIB.
An ETF could bring liquidity to the crypto market. However, the centralized risk and potential price fluctuations could impact community sentiment. It can pose challenges to the broader adoption of meme coin ETFs.
A Look At The Technical Price Chart Of BONK Coin
The BONK coin daily chart displayed shows a clear descending wedge pattern. This typically signifies a potential bullish breakout.
In this case, the BONK price has touched the lower boundary of the wedge multiple times, acting as strong support. Each bounce from this support indicates sustained buyer interest at lower levels.
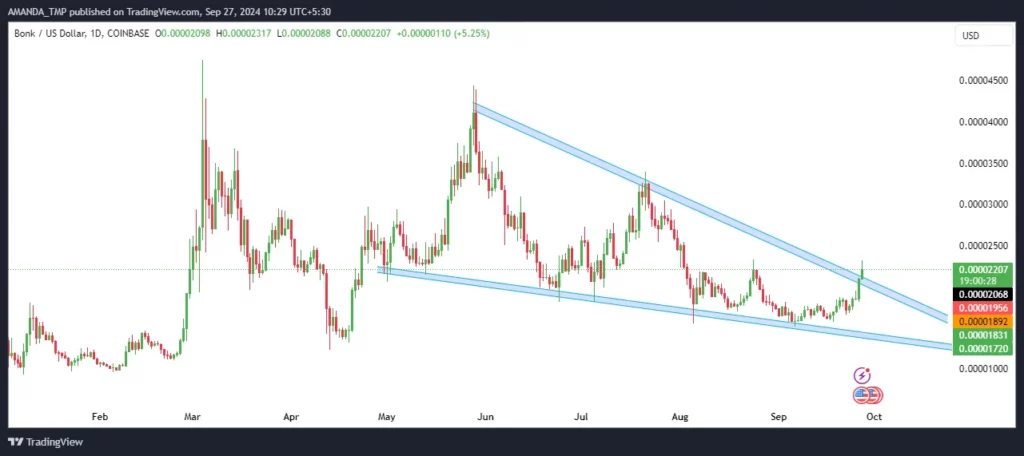
The price action showed that BONK is attempting to break through the upper trendline resistance of the wedge.
Notably, the most recent candle is green and suggests a breakout from the wedge pattern. It was supported by the BONK price closing above the 0.000022 level, approximately 5% higher than its previous level.
In the past, the price saw significant peaks in February and June. This resulted in several months of consolidation inside the wedge. BONK coin made lower highs over this period, indicating steady selling pressure. The lows have, however, leveled off in the 0.000017 area, suggesting a robust support zone.
It’s also important to remember that a breakout from a falling wedge formation frequently signals a trend reversal. In this instance, a possible uptrend may be taking over as the long-term bearish trend is about to expire.
Suppose there is a confirmed breakout. The upside targets might be the prior high zones around 0.000030 and the immediate resistance around 0.000025.
Disclaimer
This article is for informational purposes only and does not provide any financial, investment, or other advice. The author or any people mentioned in this article are not responsible for any financial loss that may occur from investing in or trading. Please do your research before making any financial decisions.




