Pearl
Pearl Bitway
 NEAR Protocol
 Sui
Sui Pudgy Penguins
 Starknet
 Pons
Pons
- SOL crypto attempted to breach the $170 mark. However, it struggled to surpass it.
- Whales dumped 40000 SOL tokens worth $6.68 Million.
After a notable bounce of over 16% from the 200-day EMA last week, the SOL price reached the $170 mark. However, the buyers failed to surpass the barrier and found resistance there.
The SOL price stayed in red over the past 24 hours amid recent speculative moves and witnessed a minor selloff. However, the coin traded with a bullish bias and may continue the upward momentum ahead.
SOL crypto price sustained gains above the significant moving averages and guided the short-term bullish outlook.
Pump Fun Offloads $6.68 Million SOL
Data from Lookonchain revealed that Pump Fun has dumped another 40,000 SOL worth $6.68 Million. It has sold 503,343 SOLs worth $78.7 Million so far.
It has also raised concerns among the market participants regarding its future effects on the rest of the Solana-based tokens. Hence, with this trend, investors were inclined to believe these constant liquidations led to selling pressure.
Solana’s Price Volatility: How Whale Activities Are Shaping the Market
The various whale activities are likely indicators of future price trends. Whale movements affect large quantities because whales constitute a large proportion of the volume.
Notably, the Pump Fun Fee account in SOL crypto made the most recent sale. The same can be explained as profit booking relating to the bear effects on Solana.
Meanwhile, the technical setup of the SOL price indicated a bullish bias. It held gains above the key EMAs and positioned for an upswing to $200 in the coming sessions.
A range breakout was recently observed, and the altcoin bounced off from the 200-day EMA levels. Solana price was trading at $165.20 at press time, noting an intraday decline of over 1.20%. It boasted a market cap of $77.51 Billion and has a volume-to-market cap ratio of 0.0383.
The Relative Strength Index (RSI) line stayed at the overbought zone, around 64 at press time. This confirmed the bullish momentum.
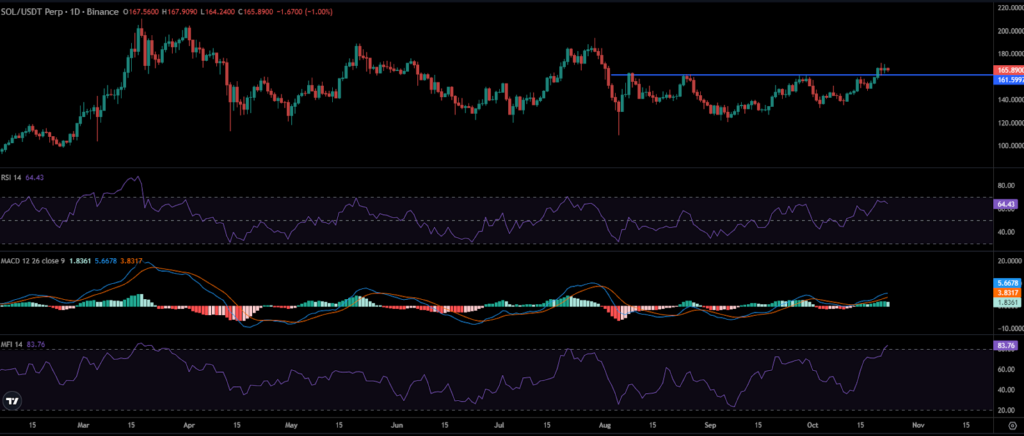
The Moving Average Convergence Divergence (MACD) indicator also allotted the green histogram readings. It conveyed a positive outlook.
Likewise, the Money Flow Index (MFI) indicator reading gave a strong bullish conviction. It rose above 80, around 83 at press time. This meant that massive inflows were occurring in Solana.
Typically, MFI readings above 60 point to sharp bullish guidance, and further upswing may be seen in the near sessions.
Daily Active Addresses Saw a Sharp Spike
Data from Artemis highlighted that the daily active addresses of SOL crypto witnessed a massive vertical spike. It reached around 7 million.
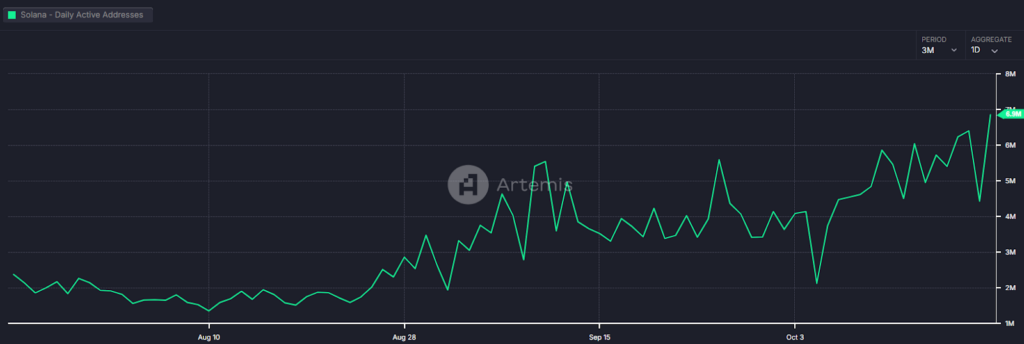
Over the past 24 hours, an upswing of over 38% was noted. That highlighted the growing investor interest. The Open Interest (OI) has dropped over 2.62% to $2.98 Billion. It signified a long, unwinding move in the intraday session.
The immediate support zones for Solana were $157 and $150. At the same time, the upside hurdles were $172 and $180.
Disclaimer
In this article, the views, and opinions stated by the author, or any people named are for informational purposes only, and they don’t establish the investment, financial, or any other advice. Trading or investing in cryptocurrency assets comes with a risk of financial loss.