
 Wisp
Wisp Pearl
Pearl Doge Pepe
 Zylo Ecosystem
 Bunker Mode
 NEAR Protocol
 Crawlerpad
- TD sequential indicator suggests a potential 25% increase in the short term.
- Stellar price might bounce back and could break the 52-week high soon.
As the broader crypto market experiences a bullish sentiment, Stellar price could see a massive bounce as one of the key indicators flashed a buy signal.
After marking its 52-week high of $0.6400 on November 24th, XLM crypto faced profit booking at the highs and declined significantly. Over the past seven days, XLM crypto price fell by over 14%.
However, Stellar price maintained strength around the 50 day EMA mark and consolidated around it, eyeing a rebound shortly.
Rebound Ahead? TD Sequential Flashes Buy Signal
Prominent Crypto analyst Ali Charts noted in a recent post on X (formerly Twitter) that XLM could see a massive upsurge next as TD sequential flashes a buy signal.
Per the analyst, the TD Sequential indicator on a daily timeframe has presented a buy signal, commonly interpreted as a sign of a price rebound.
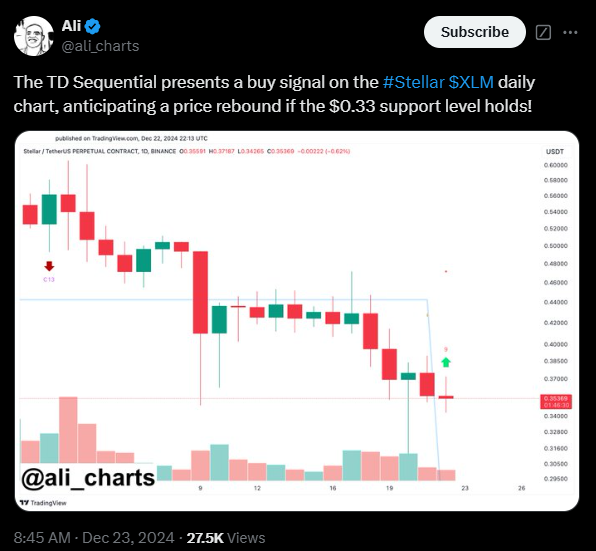
It works by tracking an asset’s price action over nine candlesticks. A buy signal is generated when the indicator reaches 9 on a downtrend.
According to Ali, XLM’s TD Sequential Indicator reclaimed the 9 spot on a downtrend during the intraday session on December 22.
If XLM price holds the support zone of $0.33, a significant price rebound could be seen in the coming days.
At press time, Stellar price traded at $0.374, noting an intraday rise of over 3.90% conveying signs of rebound. Its market cap rose to $11.32 Billion, ranked 17th among the top crypto coins.
Stellar’s crypto network activity has seen a substantial uptick over the past three days, with active addresses climbing by over 2% to 46.05k.
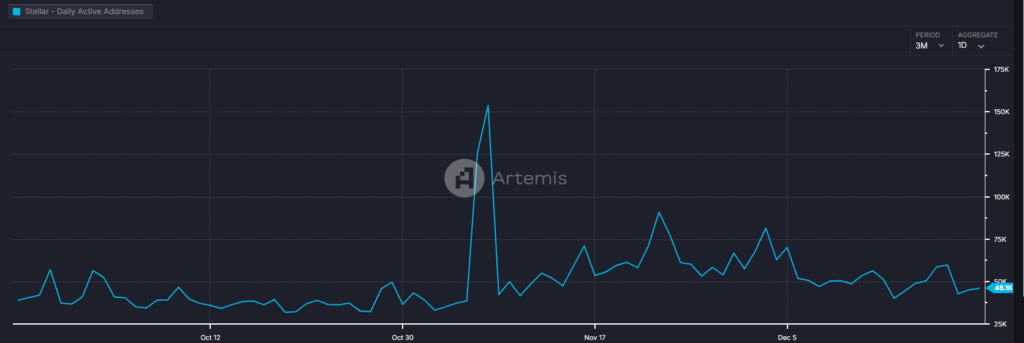
The increase in active address reflects heightened investor interest and usage. Alongside this, the Total Value Locked (TVL) stood at $48.90 Million, signifying strong confidence among the market participants.
XLM Price Prediction: Can Bulls Break the $0.400 Hurdle?
On the daily timeframe, XLM crypto formed a bullish flag pattern, it could soon breach the trendline barrier of $0.4000.
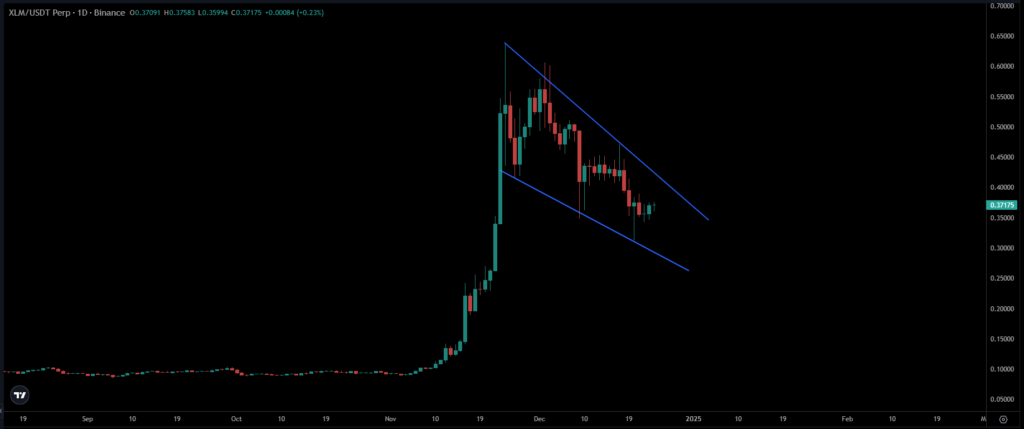
However, it maintained strength near the 50 day EMA mark and is poised for a bounce. In case of a breach above the $0.400 mark, the altcoin could regain traction and may reach the 52 week high cluster in the coming sessions.
The leading and lagging indicators signal that the uptrend was intact and significant liquidity has entered the market, which could fuel the price surge ahead.
Derivatives Market Signals Bullish Optimism
The derivatives market indicated growing bullish sentiment, as more traders have been betting on a rebound rather than a decline, based on the long-to-short ratio.
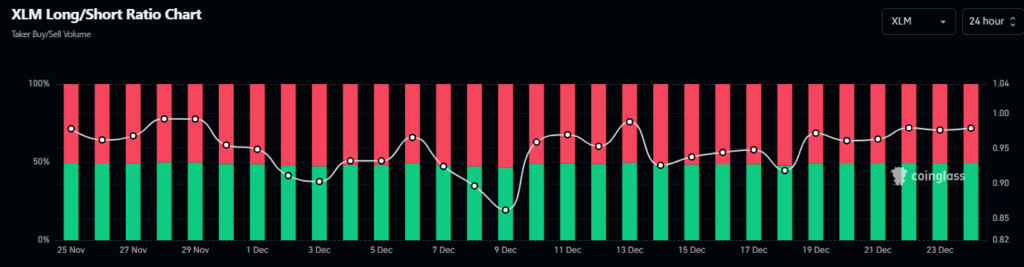
At press time, the long-to-short ratio stood around 0.9889, consisting of 52% of the long positions versus 48% of the short positions. This could increase the likelihood of a price rebound in the coming sessions.
Furthermore, the Open Interest (OI) has risen over 2.30% to $148.32 Million, signaling long buildup activity in the past 24 hours. The immediate support zones were $0.3500 and $0.3300, whereas the upside hurdles were $0.4000 and $0.4380.
Disclaimer
This article is for informational purposes only and provides no financial, investment, or other advice. The author or any people mentioned in this article are not responsible for any financial loss that may occur from investing in or trading. Please do your research before making any financial decisions.




