
 Dacity Coin
 streamoors
 astronaut
 Injective
 Celestia
 Pudgy Penguins
 Sui
Sui
- Brett price has declined by 41% in the past 17 days.
- Brett price has triggered a bearish pullback and lost 12% in less than 2 days.
Brett price has witnessed outstanding performance in November. However, the momentum was interrupted near the 0.220 mark and sellers took over the charge. From the beginning of December, the BRETT coin price has witnessed strong selling pressure and lost 41%. In the second week of December, bulls tried to lift the price from the support level of $0.160 but couldn’t.
Amid this fall, the price has declined below the 20-day EMA and displayed sharp selling. The price has triggered a bearish pullback on a daily time frame and signals a bearish forecast.
Technical Analysis of BRETT Price Over 4-H Time Frame
At press time, Brett crypto was trading at $0.125 which has dipped by 8.31% over the past 24 hours. The market capitalization was $1.24 Billion and the 24-hour trading volume was $45.56 Million.
In a 4-H time frame, the price has witnessed strong selling pressure and hovering in a parallel channel. The price was trading at the lower support level of $0.123. Suppose the price slips below this support level, major selling can be anticipated. Losing this level could spread fear among buyers which might result in panic selling.
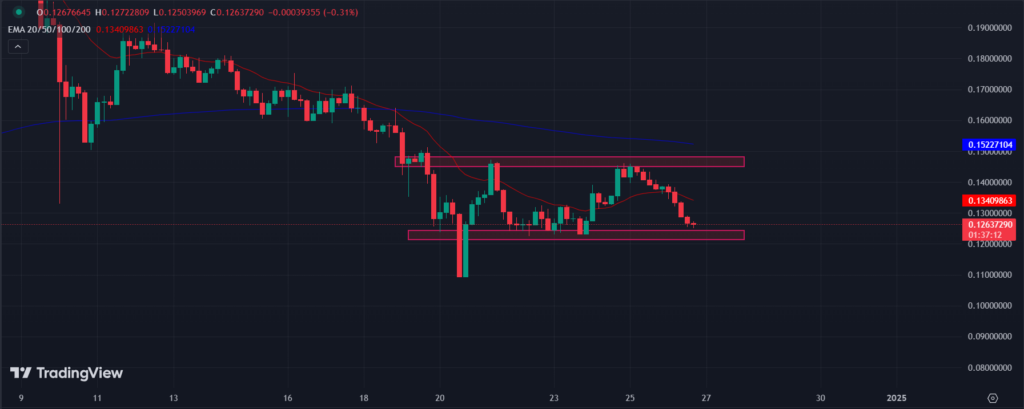
On the other hand, if the price bounces back from this support level, buying momentum could be generated. If the price forms any bullish candlestick on the support level, it is expected to reach the upper resistance levels.
If the price breaks out from the channel, buyers may get involved. Once the BRETT price sustains over the 200-day EMA, a decent rally can be experienced.
BRETT Price Formed Head & Shoulder Pattern; Could it Decline More?
The Brett price has shaped a head-and-shoulder pattern which is a bearish pattern on a daily time frame. The price has dived below the neckline, showcasing the bearish forecast. If the price remains below the neckline of $0.160, sellers may remain strong.
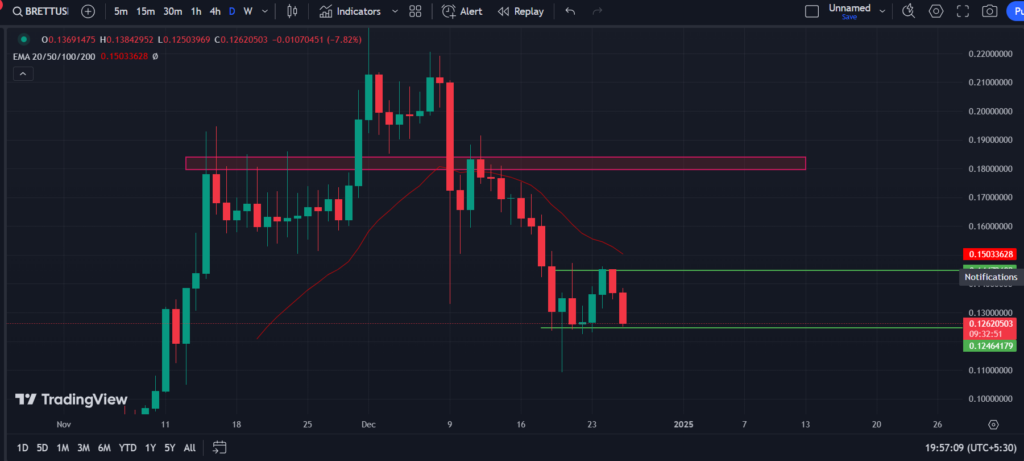
Suppose the price starts trading below the $0.120 mark, sellers might drag down the price by 30%. If buyers fail to bounce back, the bearish trend might continue for a longer period.
Conversely, if the price takes support on the $0.120 level and bounces back, buyers might participate. BRETT crypto price needs to surpass the 200-day EMA to gain the attention of buyers.
Brett Price Analysis and Forecast Based on Technical Chart
The outlook for Brett Price appears bearish, especially given the 41% decline over the past weeks and the formation of a head and shoulder pattern that signals potential further losses. With the price currently hovering around the critical support level of $0.123, a drop below this could lead to increased selling pressure and a potential 30% decline.
Conversely, if the price stabilizes and bounces back from this support, it could attract buyers and initiate a recovery, particularly if it breaks above the 200-day EMA. The coming days will be crucial for determining whether the bearish trend will persist or if a reversal is on the horizon. Investors should remain vigilant and be prepared for volatility.
Disclaimer
This article is for informational purposes only and provides no financial, investment, or other advice. The author or any people mentioned in this article are not responsible for any financial loss that may occur from investing in or trading. Please do your research before making any financial decisions.




