
 Dacity Coin
 astronaut
 Celestia
 Injective
 Bittensor
 Quantus
 Pearl
Pearl
- Exxon Mobil’s stock price is currently trading at $107.76.
- Exxon Mobil (XON)’s live market cap is $434.45 Billion.
A detailed review of the Exxon (XOM) chart reveals that the price is now demonstrating strong momentum. XOM has been trading within the boundaries of a well-defined parallel channel for some months, with prices bouncing between $101 and $117. However, recent price action has seen a dramatic reversal from the channel’s bottom border, accompanied by a jump in trading volume, resulting in a large 6.71% spike in just five days.
This significant price movement has essentially changed the current trend, sending the price over the critical exponential moving average (EMA) level. This event not only indicates a shift in market attitude, but also the start of a positive trend. As a result, there is a greater chance that the price will converge on the previously noted resistance level of $117. The current trend for Exxon (XOM) stock price reveals a strong upward momentum, presenting attractive signs for more gains in future trading sessions.
Exxon Mobil (XOM) Stock Price Analysis
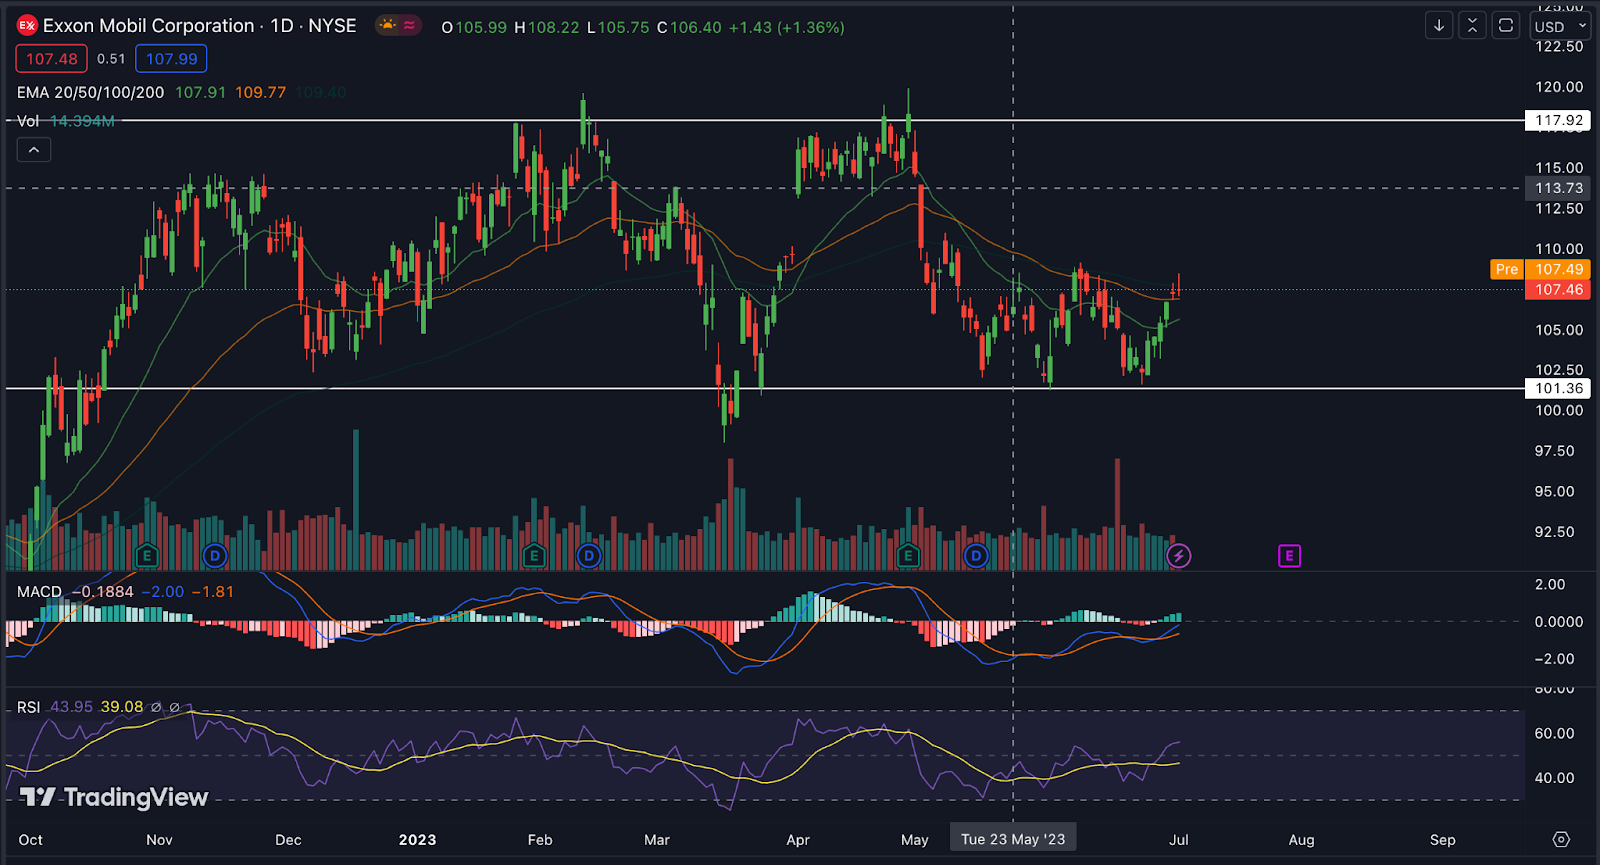
According to current market analysis, Exxon stock price shows positive indications of possible price increases. To begin, the 20, 50, and 100-day Exponential Moving Averages (EMA) are all above the price, indicating a favorable market scenario and the probability of a price gain.
Also, the MACD and signal lines are both above the zero line, resulting in a green histogram on the MACD indicator. This pattern indicates a possible market upturn and strengthens the optimistic perspective.
Furthermore, Exxon Mobil’s Relative Strength Index (RSI) has yet to enter the overbought zone, indicating that there is still an opportunity for higher growth in the near term. These indicators point to the availability of a favorable environment for possible price increases.
An examination of volume activity reveals greater market involvement and strong purchasing interest, lending credence to the concept of possible upward momentum.
Conclusion
Exxon stock price (XOM) just reversed from a critical support level, building a solid higher high structure. Also, popular indicators such as the 20-day and 50-day moving averages, RSI, and MACD are all indicating strong momentum. Traders are showing trust in XOM, and there is significant activity in the market, signaling active engagement. Taking all of these variables into account, it is clear that XOM is showing strength, and we can expect the stock to trade at higher levels in the next few days.
Technical Levels:
- Support – The current support level of Exxon Mobil (XOM) is $101.36.
- Resistance -The current resistance level of Exxon Mobil (XOM) is $117.92.
Disclaimer
The views and opinions of the author, or anyone named in this article, are for informational purposes only. They do not offer financial, investment, or other advice. Investing or trading crypto assets involves the risk of financial loss.



