
 NEAR Protocol
 Pearl
Pearl Bitcoin
 Puffer
 ZKsync
 Pudgy Penguins
 Hyperliquid
- Hedera (HBAR) is currently down -1.34% over the past 24 hours, trading at $0.04751.
- The current market cap of HBAR price is $1,498,028,078 with a loss of -1.31% in the last 24 hours.
- Over the last 24 hours, the trading volume of HBAR is $15,060,766.
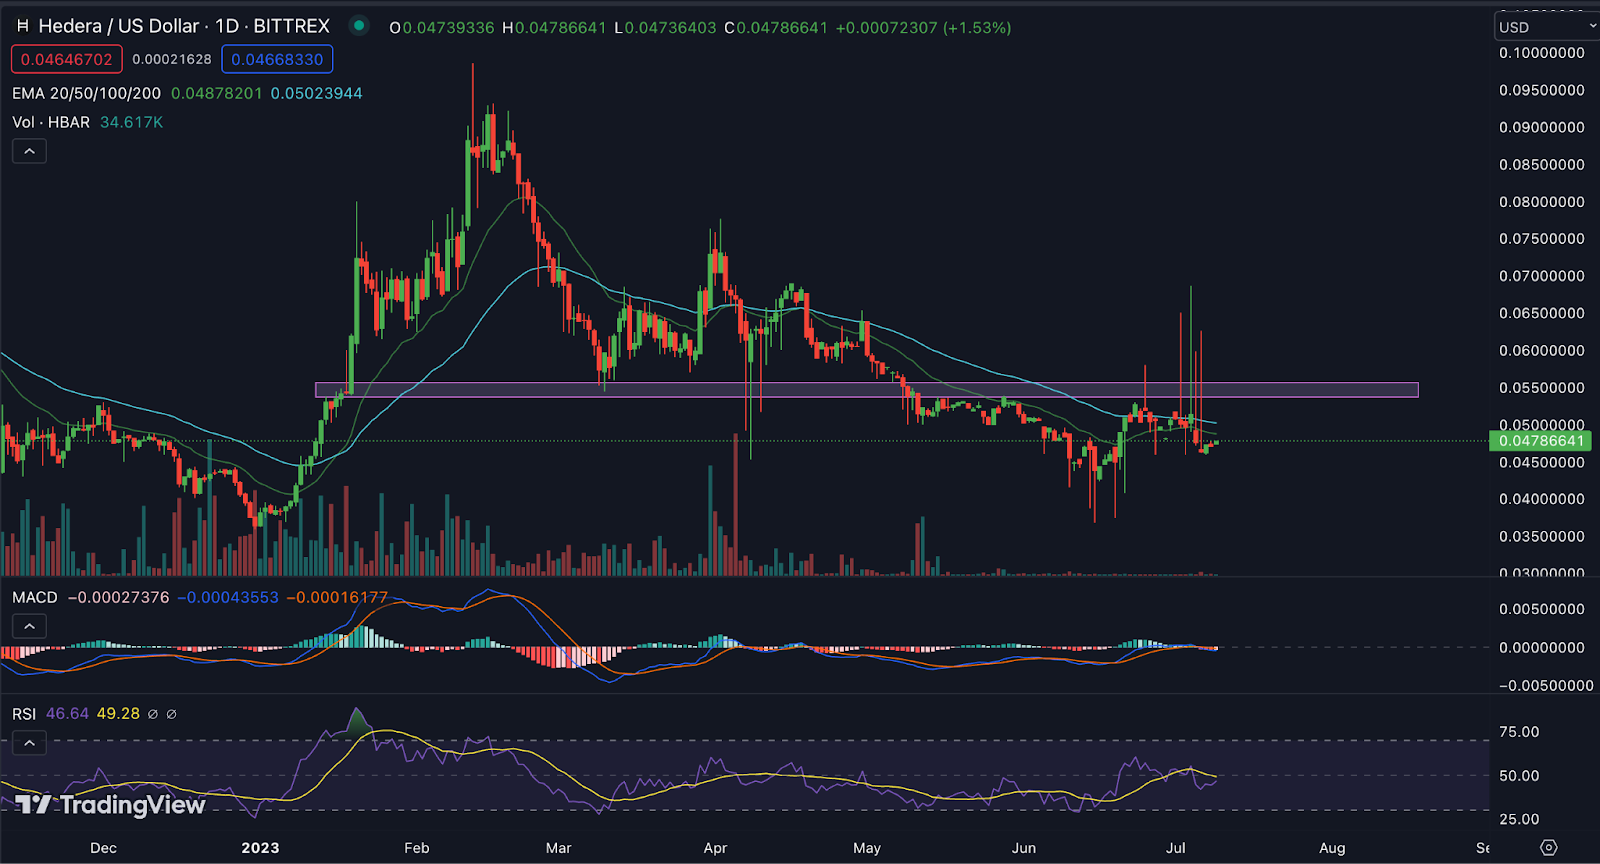
Hedera price prediction, An enterprise-grade network called Hedera has a native token called Hedera (HBAR). The HBAR price prediction developed a hammer formation a few days ago, which might cause prices to drop and the slump to deepen. In addition, the price has been moving downward since February 2023. Lower lows are indicating a downward trend in HBAR’s price.
With a loss of -1.34% over the last 24 hours, Hedera (HBAR) is currently trading at the price of $0.04751. After reaching a bottom with 0.04199 on June 16, 2023, HBAR began to rise; but, it was unable to break a lower low, causing a higher high structure to form. More recently, however, it has begun to experience rejection from higher levels.
Hedera (HBAR) Technical Analysis
EMA
Hedera (HBAR) is currently trading below both the 20-day and 50-day moving averages, which highlights the weak market and diminishing buyer interest. Hedera (HBAR) rose from the bottom and broke through the 20-day moving average, but it was unable to hold above the 20 and 50-day moving averages, which caused the price to fall.
RSI
In the price analysis of Hedera (HBAR), the RSI rose from the oversold region and broke the level of 50, but it was unable to hold above the 50 level and is currently falling from the upper levels, indicating additional market weakness. Additionally, the RSI has been making lower lows over the past few days, indicating that buyers are losing interest in the market.
MACD
Hedera (HBAR)’s MACD indicator is showing a bearish signal. A red histogram is developing and the MACD line is positioned below the signal line, and the stock may be moving in a downward trend.
Market Structure
HBAR price attempted to recover from the bottom and create a higher high structure, but it was unsuccessful because it encountered resistance at the upper levels. This led to the formation of a hammer at the critical resistance and signaled further market weakness.
Conclusion
The Hedera (HBAR) price prediction reveals that the price of the coin is not doing well right now. As of now, the market is trading under a bearish crossover of the 20, 50-day moving average and is also maintaining below the moving average. The RSI is also decreasing and displaying signals of weakness and causing future price drops.
Technical Levels
- Support Levels- 0.04464 and 0.04244
- Resistance Levels– 0.05455 and 0.06409
Disclaimer
The information provided in this article, including the views and opinions expressed by the author or any individuals mentioned, is intended for informational purposes only. It is important to note that the article does not provide financial or investment advice. Investing or trading in cryptocurrency assets carries inherent risks and can result in financial loss.



