
 Dacity Coin
 astronaut
 streamoors
 Celestia
 NeoSoul
 Sui
Sui Injective
- Lumen Technologies’ stock price is below the 50-day and 100-day EMA levels.
- LUMN’s stock price is trading at $1.69.
- Lumen Technologies’ (NYSE: LUMN)’s live market cap is $1.70 Billion.
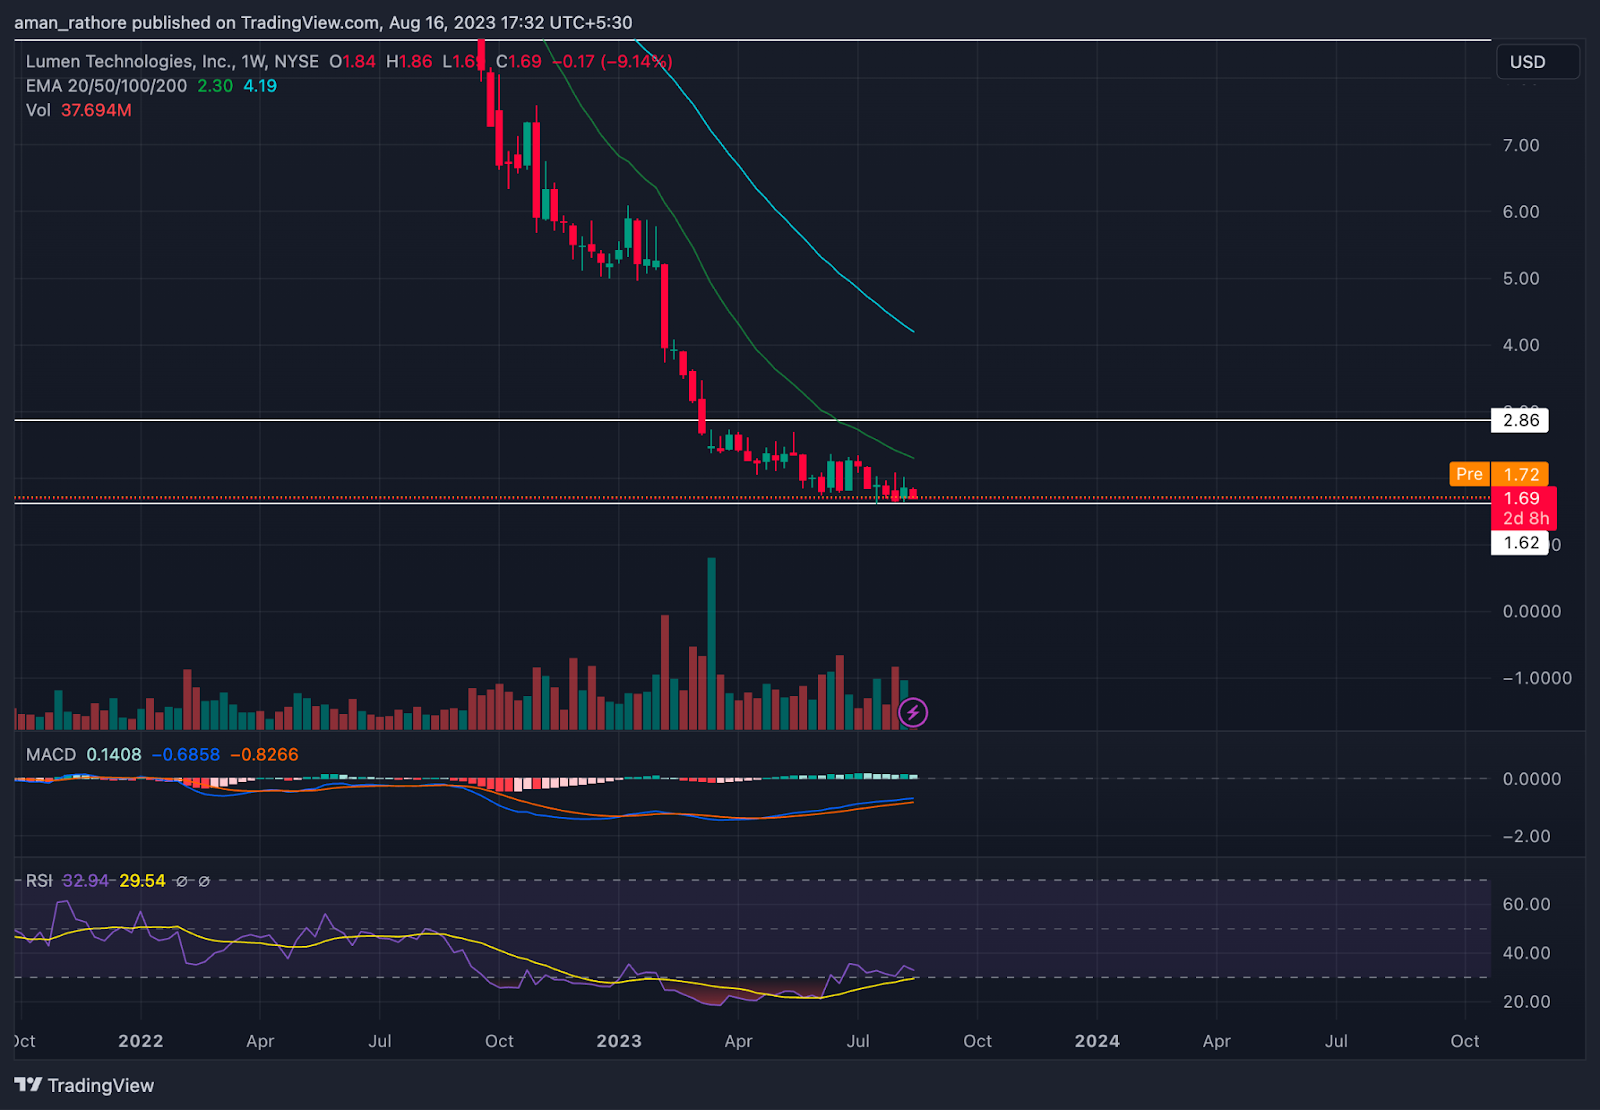
The stock of Lumen Technologies (NYSE: LUMN) is now trading in a downtrend. The LUMN stock is trading at an all-time low and the price is forming a lower low in the weekly timeframe.
The stock of LUMN has declined by 2.7% in revenue in the last 2 quarters. The revenue falls from $5.22 Billion to $3.7 Billion. The decrease in earnings has made a generation of selling pressure on the stock.
The EBITDA of the LUMN stock for the Q2 2023 is $1.21 Billion. The stock has shown a decline of 4% in EBITDA year-over-year change.
Lumen Technologies’ stock price made a high of $49 in June 2009 and after that, the price is declining. The stock price has shown a decline of 98%.
Currently, the LUMN stock is trading at $1.69 level. In the last 24 hours, the stock has shown a decline of almost 6.7%. Currently, the stock is near an all-time low level and the price is likely to decline in the upcoming days.
Lumen Tech’s (LUMN) general structure is building a negative pattern and the price is likely to fall in the upcoming future.
Lumen Technologies (LUMN) Stock Price Analysis
EMA
The price of Lumen Technologies (LUMN) shares is trading below the 50-day and 100-day EMA levels. This indicates that the price of the LUMN stock is experiencing a weak momentum and the price is likely to decline in the upcoming days.
MACD
Both the signal line and the MACD line are below the zero line for the price of the LUMN stock. Additionally, it is possible to detect the growth of a red histogram which denotes the stock’s price is likely to fall in the future.
RSI
The 14-day SMA line is close to 32 and the RSI line for the Lumen Technologies (LUMN) stock price is at 30. The fact that both lines are in negative territory suggests that the price may decline in the future.
Conclusion
As per the analysis, Lumen Technologies’ (LUMN) stock price is currently moving in a downtrend direction. The volume of the stock is also declining. The revenue of the stock has shown a major decline. The indicators like MACD, RSI, and EMA are pointing toward a further decline in the stock price.
Technical Levels
- Support Level– $1.69.
- Resistance Level– $2.86.
Disclaimer
The views and opinions of the author, or anyone named in this article, are for informational purposes only. They do not offer financial, investment, or other advice. Investing or trading crypto assets involves the risk of financial loss.



