
 Pearl
Pearl Bitway
 Monad
Monad Ondo
Ondo Derive
 Walrus
 Zcash
Zcash
- DYDX crypto is trading +97.81% above its all-time low price.
- DYDX crypto is showing an advance of +97.08% in derivatives trading volume resulting in $160.68M.
Price Data of The DYDX
The Long/Short ratio for the DYDX crypto in the last 24 hours is 0.8584 with a short liquidation of $71.66 thousand. Also, the market cap of the crypto has slightly advanced by +4.39% resulting in an advance of 47.84% in the trading volume of the DYDX crypto.
The circulating supply of DYDX is 156.2 million tokens and a max supply of 1.0 billion tokens. The fully diluted market cap of the crypto is $1.9 billion and a market cap dominance of 0.032% in the overall crypto market.
Volume/Market cap ratio of the DYDX price is 0.1654 resulting in the market cap rank of #101. The crypto has also declined by -4.8% in the last 7 days. The community looks bullish on the DYDX coin because 66% of users have voted for bullish as per Coingecko.
DYDXUSD Technical Analysis
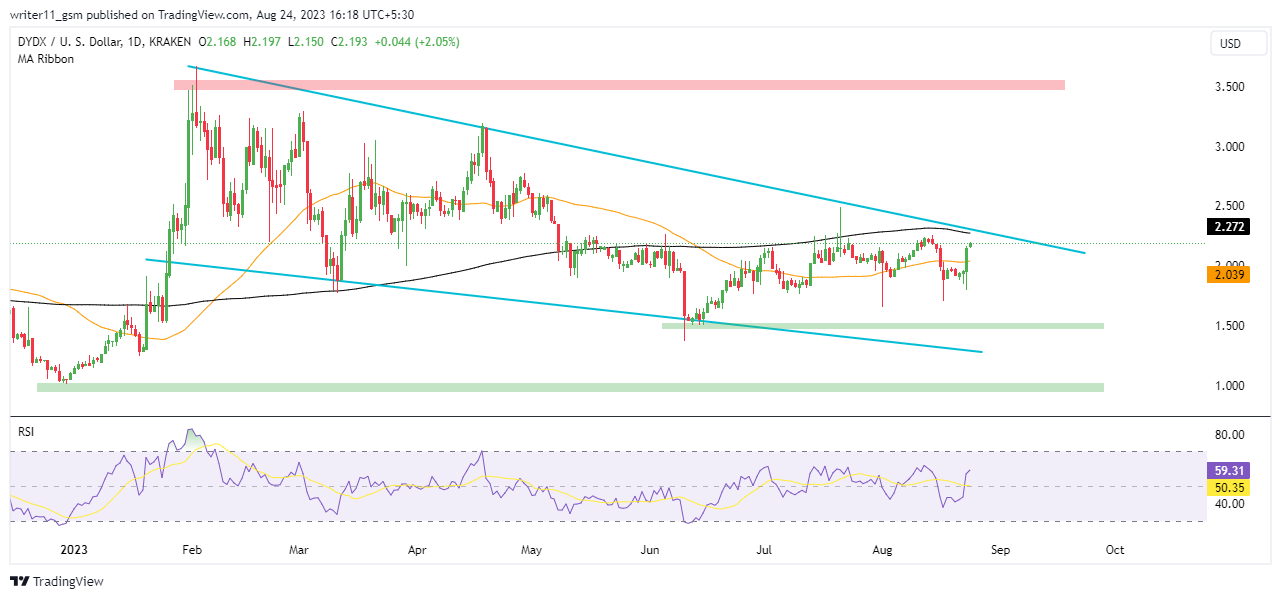
The price of DYDX coin has been consistently declining from the higher levels making lower low swings. It caused the formation of a dynamic resistance at the higher levels.
The market is weak for DYDX because the price has been falling for a long time. The 50-day EMA line has crossed below the 200-day EMA line, forming a death cross. This is a bearish sign indicating the downtrend is strong.
The RSI for the DYDX coin is weak on charts as it is trading without any momentum. It declined below the level of 50. This represents the lack of momentum in the crypto.
Technical overview of DYDXUSD
The stock is not doing well on the daily timeframe, as the technical indicators show a sell signal. Out of 26 indicators, only 6 are positive, while 10 are negative and 10 are neutral. This means that the price is more likely to decrease than increase.
Conclusion
DYDX price is consistently declining from the higher levels. It is in a downtrend trading inside a falling wedge pattern. The EMA and RSI are also supporting the decline in price, which represents the presence of sellers in the market.
If the price breaks above the dynamic resistance, we might witness a change in trend otherwise the price may continue to decline to lower levels.
Technical Levels
- The support levels for the DYDX coin are – $0.961 and $1.504
- The resistance levels for the DYDX coin are – $2.70 and $3.50
Disclaimer
The information provided in this article, including the views and opinions expressed by the author or any individuals mentioned, is intended for informational purposes only. It is important to note that the article does not provide financial or investment advice. Investing or trading in cryptocurrency assets carries inherent risks and can result in financial loss.




