
 NEAR Protocol
 Pearl
Pearl Bitcoin
 Puffer
 ZKsync
 Pudgy Penguins
 Hyperliquid
- The M&G stock price is trading at 186.65 GBX.
- The company stock price has given the breakdown of 188.65 GBX and is sustaining below it.
M&G Plc was founded in 2017. It is a global investment company that offers services for saving money and investing. The firm operates through three business segments which are Asset Management, Retail and Savings, and Corporate Centre. The company is listed on the London Stock Exchange (LSE) and is the part of FTSE 1000 index.
M&G Plc Stock: Technical Analysis
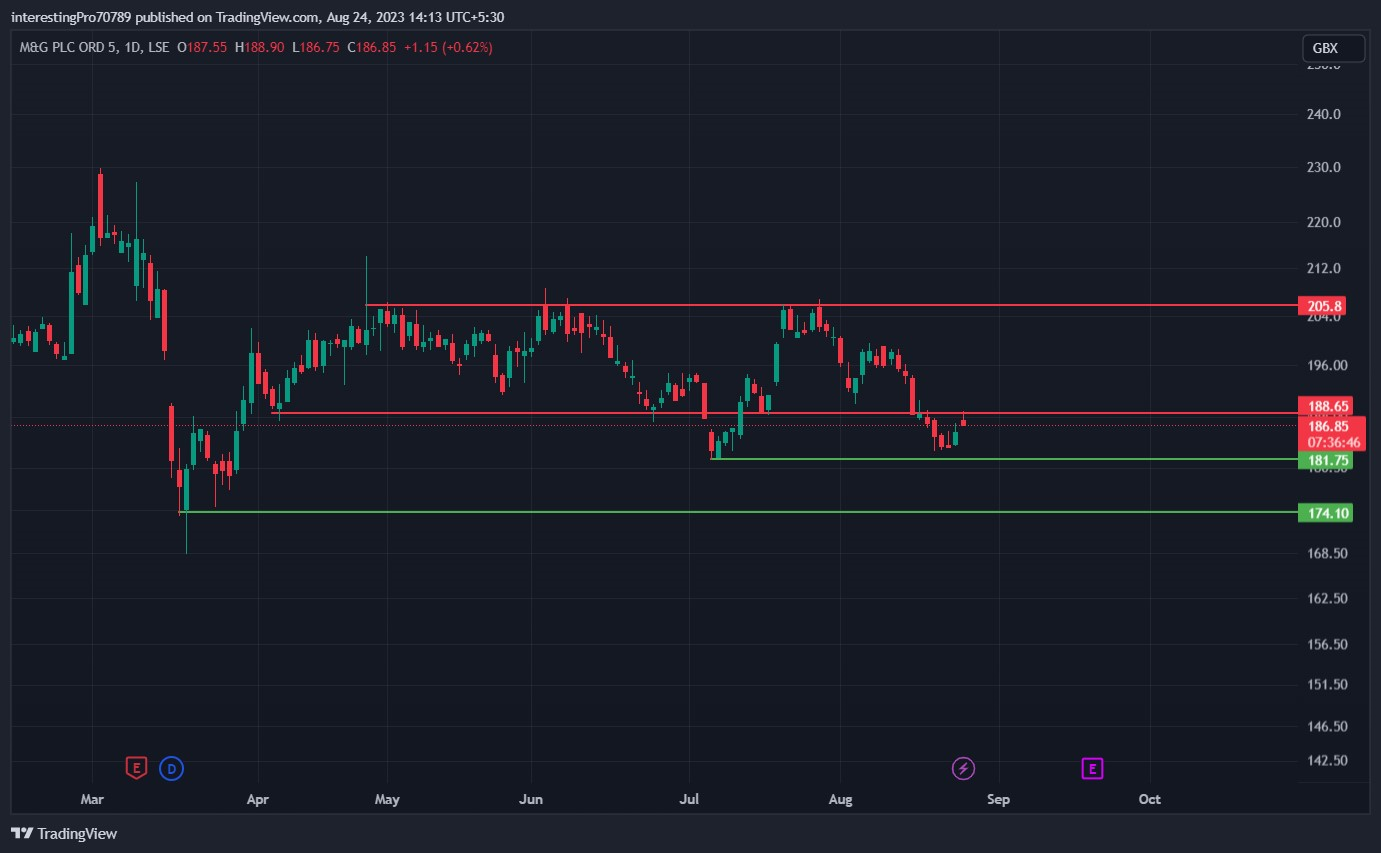
The M&G stock price formed a support of 174.10 GBX in March 2023 and commenced a bullish rally. The price continued the bullish rally of 205.8 GBX after which it started to fall.
After the rejection, the price got stuck into the range of 205.8 GBX to 188.65 GBX. The stock price experienced pressure from sellers at 205.8 GBX and buyers at 188.65 GBX. It caused a consolidation phase in the market.
The price gave a breakdown of 188.5 GBX in july but faced an immediate rejection at 181.75 GBX level. It reclaimed the 188.65 GBX support and turned the breakdown into a fakeout. After reclaiming the 188.65 GBX support, the price rallied again to 205.8 GBX resistance.
After reaching 205.8 GBX resistance, the sellers again showed their dominance. They pushed the price in the downward direction.
Again in August 2023, the price gave the breakdown of the 188.65 GBX support. The price is currently sustaining below 188.65 GBX. So, the price has to form a bearish candle below 88.65 GBX now for confirmation of the downtrend. The second confirmation will come after the price closes below the 181.75 GBX swing to continue its downtrend to 174.10 GBX support.
The price may fail to sustain below and reclaims the 188.65 GBX like previously. It may go towards 205.8 GBX resistance again if that happens.
Technical Indicators’ Prediction About the Current Trend
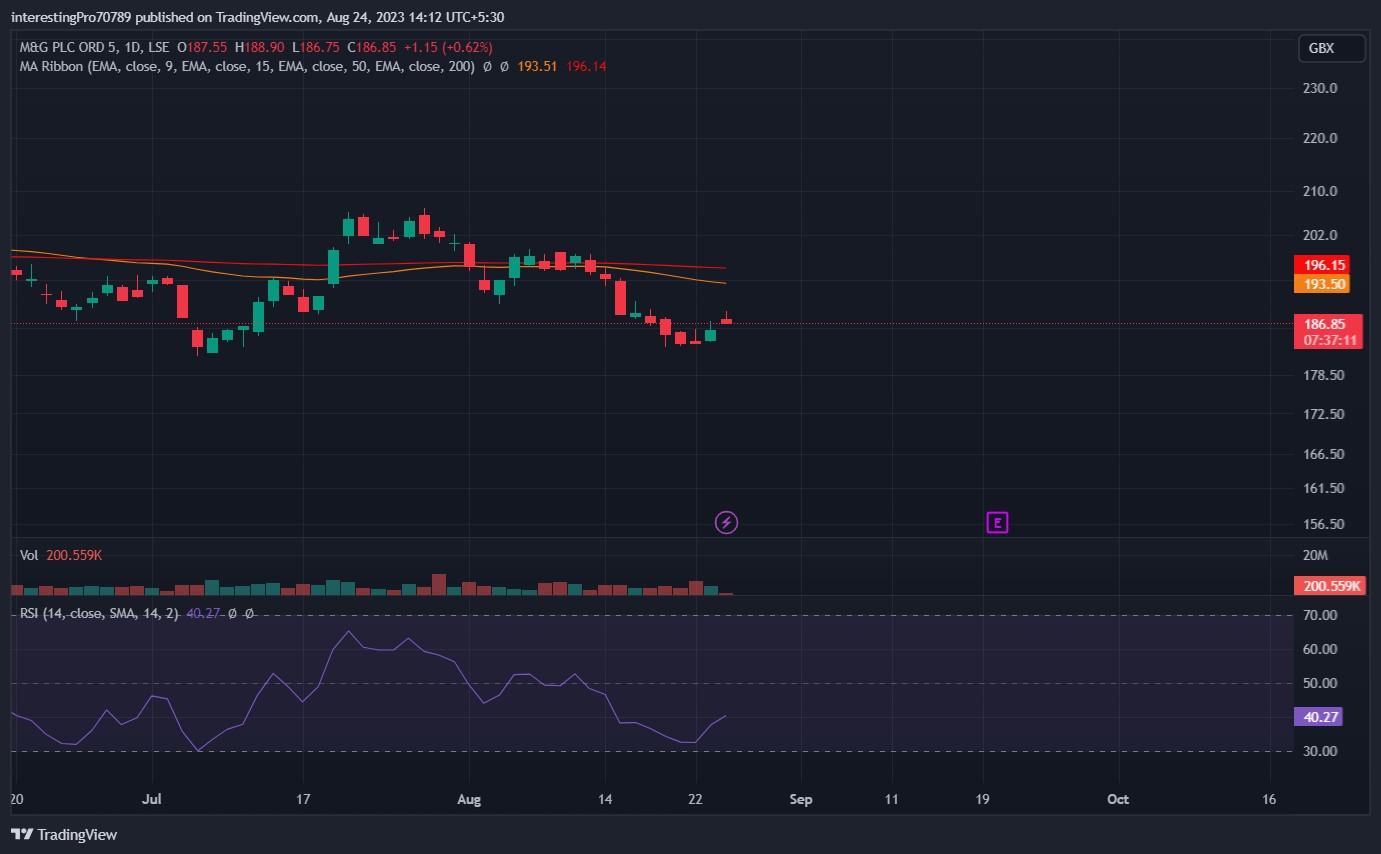
The 50-EMA (yellow line) is at 193.50 GBX and the 200-EMA is at 196.15 GBX. The 50 and 200 EMA lines are sideways. The price of M&G is trading below the 50 and 200 EMA. It indicates that the price is bearish sentiment, but the buyers are also influencing the price. If the price takes rejection from the EMA’s, the downtrend is likely to continue.
The relative strength index (RSI) is at 40.27. The RSI is currently in neutral territory. This indicates that the price is taking pressure from the sellers and there is also an influence of buyers on the price.
Conclusion
The M&G Plc stock price is currently in bearish sentiment. The price has given the breakdown of the 188.65 GBX support. If the stock price forms a strong bearish below 188.65 GBX, it will be the first confirmation for a downtrend. The second confirmation will come after the price if it closes below the 181.75 GBX. All the indicators are bearish or neutral at the time of writing. Most Analyst ratings are neutral sentiment in the price.
Technical levels
Resistance levels: 188.65 GBX and 205.8 GBX.
Support levels: 181.75 GBX and 174.10 GBX.
Disclaimer
The views and opinions stated by the author, or any people named in this article, are for informational purposes only. They do not establish financial, investment, or other advice. Investing in or trading crypto assets comes with a risk of financial loss.



