
 Dacity Coin
 Injective
 Pearl
Pearl Bittensor
 Pudgy Penguins
 Celestia
 NEAR Protocol
- The previous closing price for the MRK stock was $111.30.
- The basic EPS of Merck & Company Inc. is $1.23 with floating shares of 2.538 Billion.
The dividend paid by the MRK per share in 2022 is $2.80 following a dividend yield for the year of 2.52%. The payout ratio of the company is 49.02% and the dividend pay date is 06/10/2023. The last dividend paid per share was $0.73.
The PE ratio for Merck & Company Inc. (MRK) stock is 88.30 for the year 2022, indicating an increase of +30.32% compared to the previous year. A high PE value often suggests that investors are willing to pay a higher price for the MRK stock, but it can also suggest the stock might be considered overvalued.
The share price of MRK has risen by more than +22.00% over the course of a year. The revenue for MRK shares has grown from $48.91 billion in 2021 to $58.47 billion in 2022, accompanied by a slight increase in net income, which reached $14.52 billion in 2022. However, the profit margin has experienced a slight decline, moving from 26.68% in 2021 to 24.83% in 2022.
Merk & Company Inc. Debt Analysis
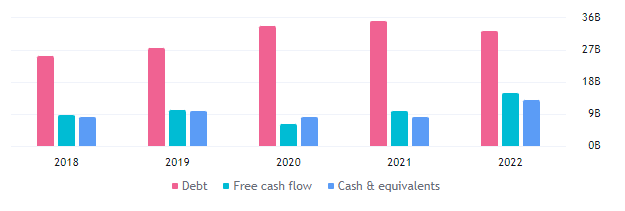
The debt for the company has slightly declined by more than $3 Billionin a year from 2021 to 2022 and the free cash flow has advanced from $9.66 Billion to $14.71 Billion. This points to the good performance of the company in the past year.
MRK Technical Analysis
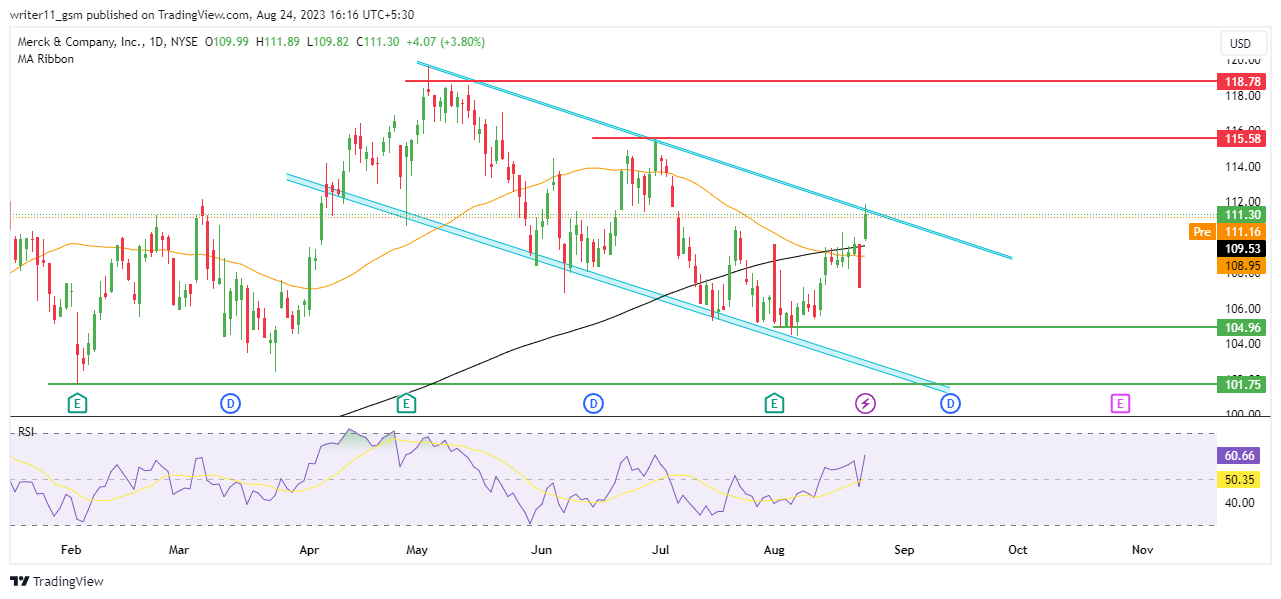
The price of MRK stock is consistently declining from the higher levels, leading to the formation of a falling wedge pattern and it is preparing to break out above the same.
The 50-day and the 200-day Exponential Moving Averages (EMAs) are trading in a death crossover on the daily charts but the price is trading above both the EMAs, and this represents uncertainty in the current trend.
The RSI for the MRK share is currently trading above the 50-level and has also crossed the level of the 14-day SMA line, which indicates the presence of buyers in the market.
Technical Overview of MRK Stock
1 indicator is giving a sell signal,10 indicators are acting neutral, and 15 indicators are giving a signal for buy, which makes the stock bullish on the daily timeframe, suggesting a further advance in price.
Conclusion
Merck & Company Inc stock price is about to break above the falling wedge pattern as it is trading above the EMAs and the RSI is also acting bullish. The financials of the company are also good.
Therefore, MRK stock can be a good candidate for the portfolio if it manages to sustain above the level of $110 as the price may continue to advance to the higher resistance levels.
Technical Levels
- The support levels for MRK Stock are – $101.00 and $104.00
- The resistance levels for MRK stock are – $115.00 and $118.00
Disclaimer
The information provided in this article, including the views and opinions expressed by the author or any individuals mentioned, is intended for informational purposes only. It is important to note that the article does not provide financial or investment advice. Investing or trading in cryptocurrency assets carries inherent risks and can result in financial loss.



