
 Pearl
Pearl ZKsync
 Bitcoin
 Starknet
 Quantus
 Puffer
 Lighter
- Gilead Sciences Stock has been consolidating since November 2022.
- The GILD stock has formed a Flag and Pole Pattern on the daily chart.
- The net income of GILD shares has declined by 26% in the financial year 2022.
The current market price of the Gilead Sciences Stock- $74.74
Gilead Sciences has surged for 4 consecutive trading sessions. The Gilead Sciences stock has also seen a long consolidation phase from 2017 to 2023. The stock was traded in a flat range in this time period. The broader range for this price consolidation was $50 and $68. Flat revenue and income growth could be a possible reason for this. The stock price has shown a great jump from the year 2012 to 2015.
After that, the stock has gone into a deep correction mode. Its price has been trading flat in a range of $72 and $80, for the last 4 months. The share price has surged massively by over 47% in the month of October-November in 2022. If we observe the rise, then it is clearly visible that the stock needs some consolidation to continue the momentum.
Is the Technical Analysis Stating the Clear Picture?
The Gilead Sciences has formed a Flag And Pole pattern on the daily chart. The stock price has been trading under this pattern for so long. GILD stock’s price has made an attempt to give a breakout from this level but failed to do so. The resistance level of the pattern is present near the level of $79. If we consider the support level of the pattern, it is present at the level of $72.
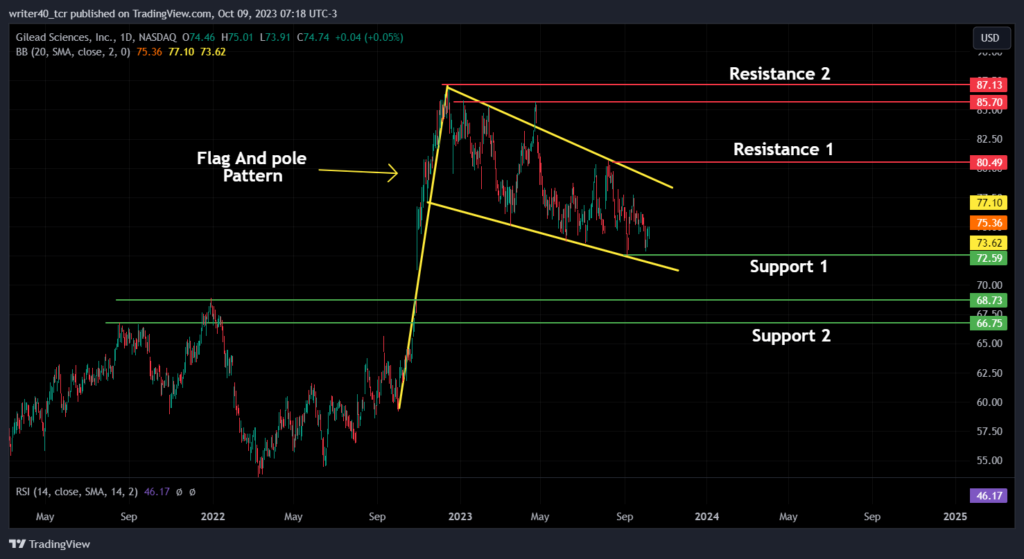
GILD stock price has recently created a support zone near the price of $72.59. The other support levels for the price are present at the level of $68.73 and $66.75. This level acted as resistance before the price breached this level in October 2022. If we consider the Resistance levels for the stock, they are present at the level of $80.49 and $85.70 level.
A Brief Explanation About the Indicators
Bollinger Bands
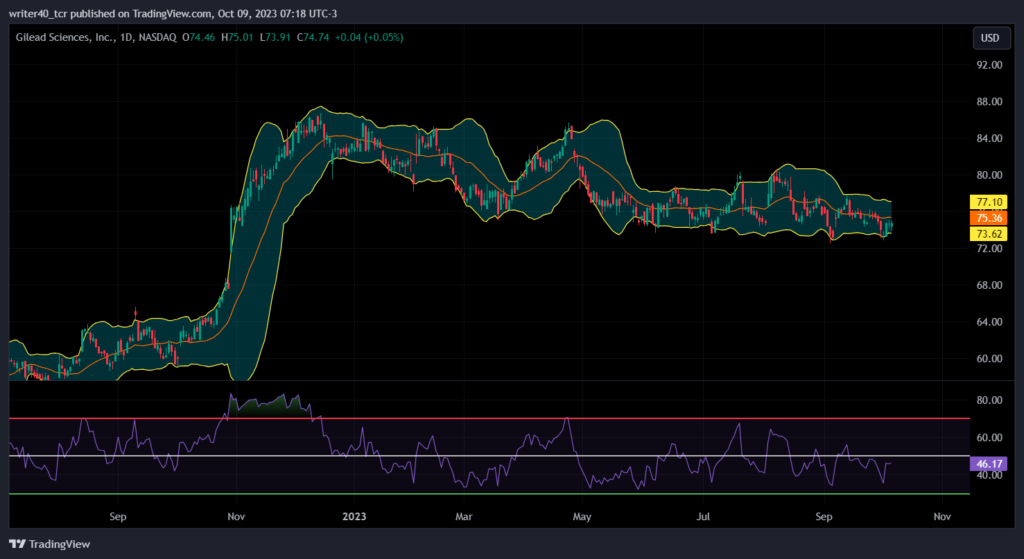
The Bollinger Band has been squeezed for so long, which indicates the lack of volatility in the stock. The stock has been taking support from the lower band of the Indicator. The upper band and lower band are present at the levels of $77.10 and $73.62 respectively.
Relative Strength Index
Currently, the RSI is placed below the 50 line, which indicates that the price is bearish. If we examine the slope of the RSI, it is rising. It shows that the bulls are gaining some momentum.
Conclusion
Gilead Sciences Stock price has been consolidating for so long because of poor financial growth. If the company posts a good financial number in the upcoming quarters, we can see some good upside. If the price breaks the flag and pole pattern on the upside then it can try to achieve the level of $80.49 and $85.70. The support for the price is present at the level of $72.59 and $68.73.
Technical Level
Resistance – $80.49 and $85.70
Support – $72.59 and $68.73
Disclaimer
The views and opinions stated by the author, or any people named in this article, are for informational purposes only. They do not establish financial, investment, or other advice. Investing in or trading crypto assets comes with a risk of financial loss.



