
 Bitcoin
 ZKsync
 Pudgy Penguins
 Pearl
Pearl Quantus
 Starknet
 NEAR Protocol
- UBS has maintained its “BUY” rating on the Kinder Morgan stock.
- Kinder Morgan stock price has been moving within a symmetrical triangle pattern.
- The company has fallen short of the estimated earnings by a slight margin.
Kinder Morgan (NYSE: KMI) has been in a sideways trend for more than a year and it has declined by over 9% (YTD). It is still trading sideways and it seems like the stock is forming a base for the next big move on either side. The company released a financial report on 19 October 2023. According to this, the company has slightly missed a Wall Street estimate about the earnings and the stock has seen some pressure since then.
If we observe the broader picture, the KMI stock price has been in a horizontal range between $7.5 and $18. It has formed an inverted flag and pole pattern on the daily chart in a larger time frame. The stock price has formed a new range between the levels of $18.68 and $15.55.
UBS has maintained its previous rating of “BUY” on the stock. However, the firm has cut down the target price from $23 to $22. This cannot impact the stock price much but it can cause some worry to investors. Furthermore, the stock price movement in the past few years is not in favor of the target price.
Synopsis of the Kinder Morgan Stock Chart
The KMI stock price has formed a symmetrical triangle pattern and it is inching closer to the lower trendline of the pattern. The trendline support is present near the level of $16.05 and the trendline resistance is present near the level of $17.80. The stock price has been declining for the past few days and it melted down over 3.94% in a week, which indicates bearishness.
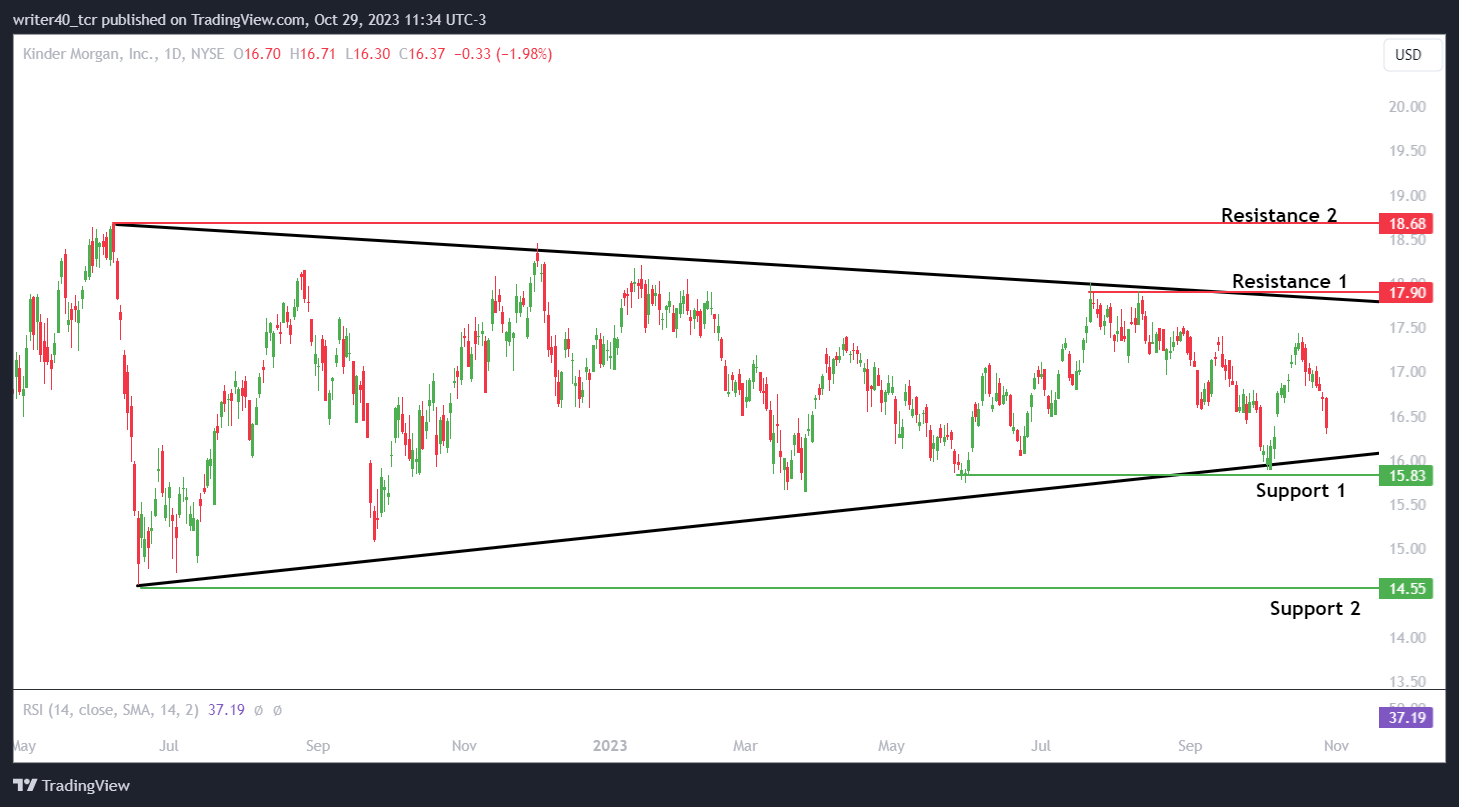
The KMI stock price will try to break the pattern in the future and try to achieve the levels of $17.90 and $18.68 on the higher side. $15.83 and $14.55 can act as a support level for the stock.
Overview of the Exponential Moving Averages and Relative Strength Index
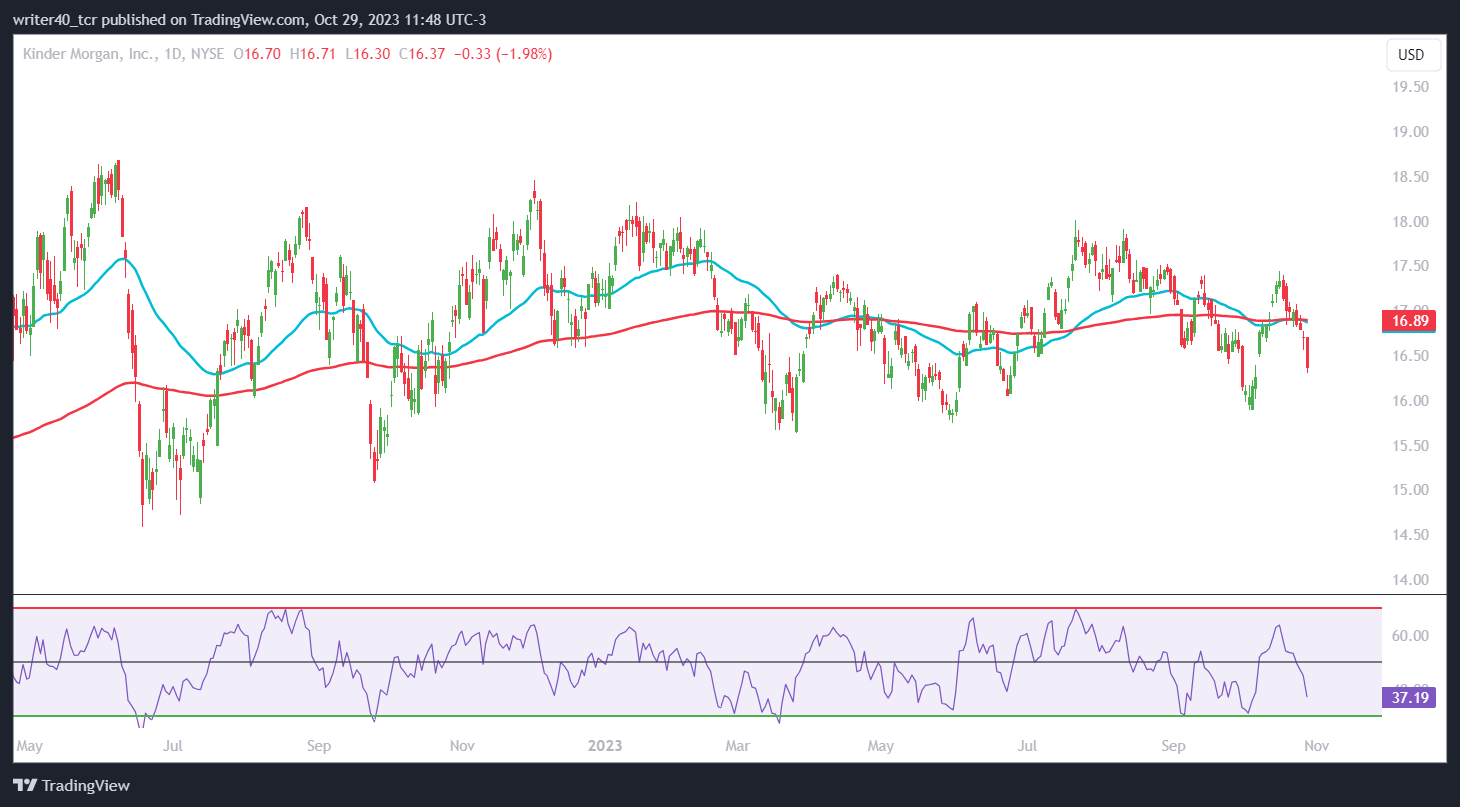
The KMI stock price is currently situated below the 50-day exponential moving average (EMA) and the 200-day EMA. However, the slope of the EMA is flat and the stock has not been reacting much to the EMA crossovers. The relative strength index (RSI) is curving sharply below the 50 level and this is a bearish sign.
Conclusion
After observing the chart structure of KMI stock, it looks difficult for the stock price to give a breakout anytime soon. If the price breaks the lower level of $16.05, then it may fall to $15.83 and then to $14.55. However, a breakout from the pattern at $17.80 can push the price towards the levels of $17.90 and $18.68.
Technical Level
Resistance – $17.90 and $18.68
Support – $15.83 and $14.55
Disclaimer
The views and opinions stated by the author, or any people named in this article, are for informational purposes only. They do not establish financial, investment, or other advice. Investing in or trading crypto assets comes with a risk of financial loss.



