
 Bitcoin
 ZKsync
 Pudgy Penguins
 Pearl
Pearl Quantus
 Starknet
 NEAR Protocol
- Osmosis uses the SHA_256 hashing algorithm for hashing blocks.
- Osmosis is a DEX for the Cosmos ecosystem that offers customizable liquidity pools, superfluid staking, and AMMs as serviced infrastructure.
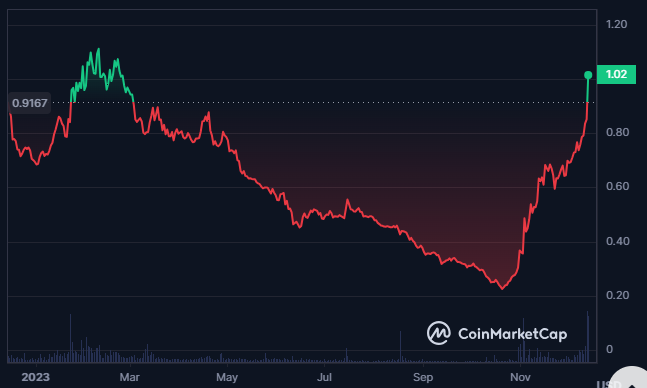
Osmosis is a DEX for Cosmos that offers customizable pools, superfluid staking, and AMMs as infrastructure. It connects all chains over IBC and invites developers to build a cross-chain trading suite. OSMO is its governance token with a ‘thirdening’ schedule and a diverse distribution.
The price of the OSMO crypto is $1.01 and its market cap is $499.13 Million, making it the 98th largest cryptocurrency in the market. The amount of money traded in OSMO in a day is $87.554 Million, which is 17.94% of its market cap, as per CoinMarketCap.
The current market cap dominance of the OSMO crypto is 0.04%, as per Coingecko. Additionally, the circulating supply of the crypto is 492.59 Million OSMO. This further results in a fully diluted market cap of $1.013 Billion.
OSMO Blockchain Data
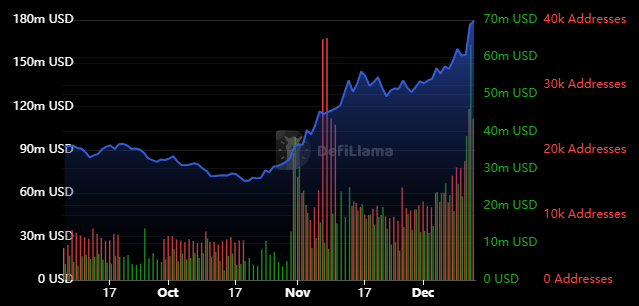
The blockchain data provided by DefiLlama shows that the volume of the crypto is consistently rising with the number of active addresses. Furthermore, there has been an increase in the TVL of OSMO. The data shows that there is significant activity taking place in the Osmosis crypto community.
OSMO Technical Analysis
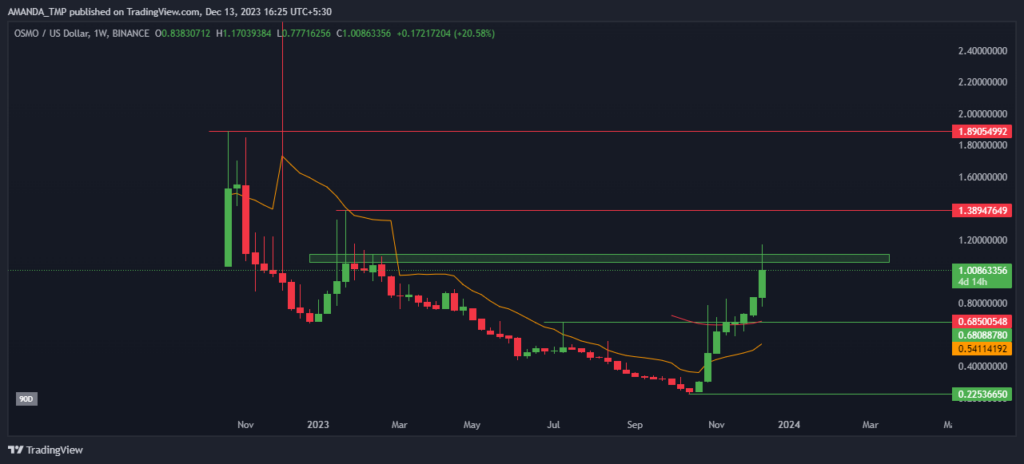
The OSMO crypto is consistently rising to higher levels by taking rejection from the lower levels. Based on the current scenario, the price is at a crucial resistance level. If the price breaks above the level of $1.170, it might lead to new highs. This is because a breakout will lead to a bullish trend.
OSMO/USD Chart by TradingView
With the bullish rolling VWAP on the daily chart of OSMO crypto, its price is above the 50-day and the 200-day EMAs. Additionally, the EMAs are forming a golden cross on the charts. The data shows that the buyers are active in the market and dominating over the price.
Moreover, the MACD is also giving a buy signal as the signal line situated above the MACD line. This results in a bullish cross and green volume blocks are building up on the MACD indicator.
Conclusion
The price of OSMO is $1.01 and rising, with strong technical indicators and high trading volume. The price of the crypto might continue to rise to higher levels in the future as the technical charts are supporting a strong uptrend.
Technical Levels:
- Support levels: $0.2253 and $0.6808
- Resistance levels: $1.389 and $1.890
Disclaimer
The views and opinions stated by the author, or any people named in this article, are for informational purposes only, and they do not establish financial, investment, or other advice. Investing in or trading crypto or stock comes with a risk of financial loss.




