
 Crawlerpad
 Aerodrome Finance
 Zylo Ecosystem
 Wisp
Wisp Pearl
Pearl Sonic
Sonic Quantus
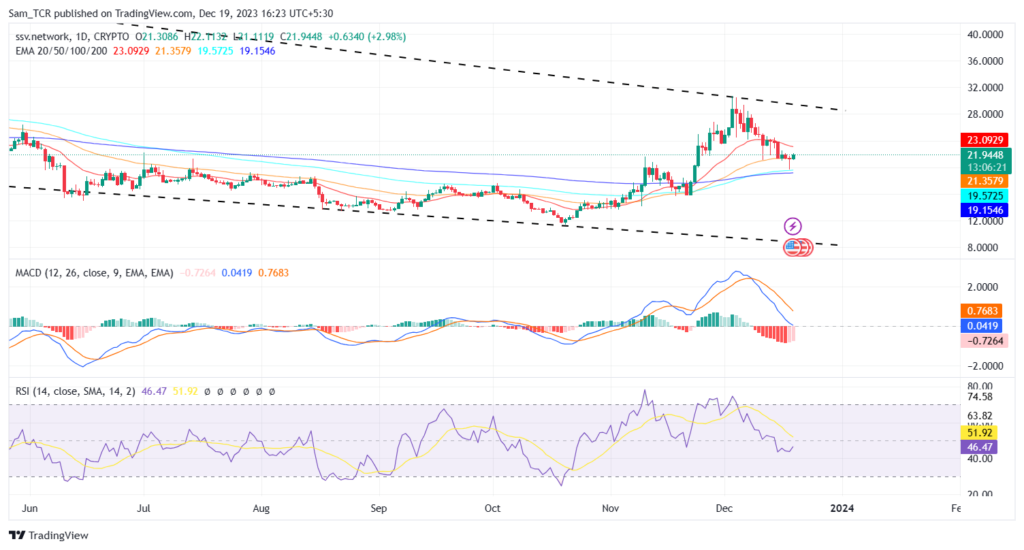
- The SSV token is exhibiting bearishness and is now, showing a bearish tendency as it slumps below the 20-day EMA.
- The RSI and MACD are falling sharply.
ssv.network is a decentralized staking infrastructure that allows the distributed operation of an Ethereum validator. It is done by dividing a validator key among four or more non-trusting node instances (‘multi-operator node’).
The nodes work together to perform the validator’s duties under a consensus mechanism. In simple terms, the protocol changes a validator key into a multisig construct controlled by a consensus layer.
The unique protocol of ssv.network improves its strength, liveliness, and fault tolerance of nodes across the Ethereum ecosystem.
Sharing validator keys among node instances implies a significant improvement compared to existing staking schemes that lack in, Validator keys that can be kept offline, ‘Active to active’ redundancy, Node instances adaptability, and Threshold signature scheme.
ssv.network is the first public implementation of the SSV primitive, which started as a research piece by the Ethereum Foundation back in 2019 and since then has grown to a DAO-governed, community-driven network of stakers, builders, and node operators.
ssv.network is quickly approaching mainnet. Planned for the start of 2022, the genesis implementation of the Decentralized Staking Infrastructure will be focused on Ethereum, after which, the network is expected to extend to other POS chains.
Can SSV Break Out of the Downward Channel?
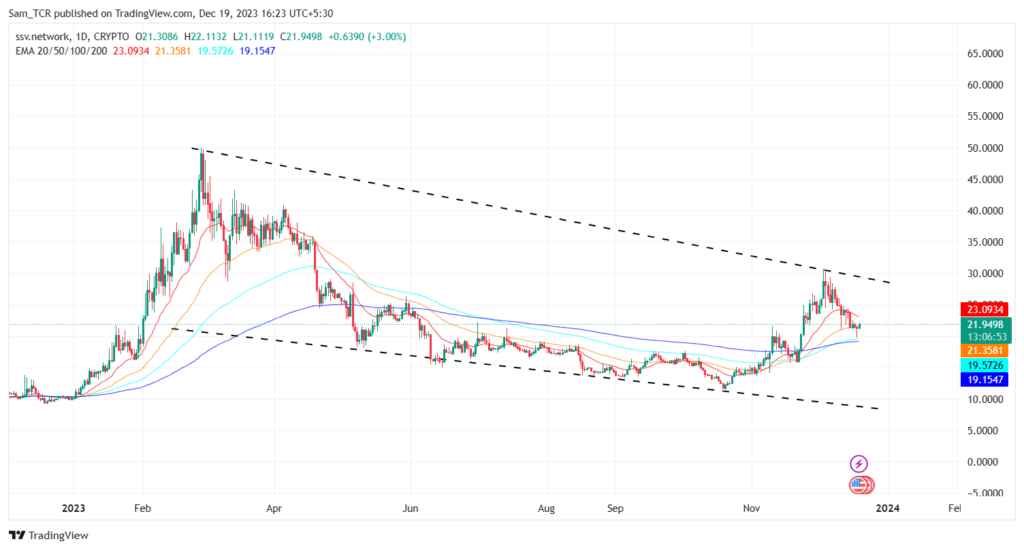
The SSV price is struggling to stay near the trendline resistance, which is a big obstacle for the asset. The asset price needs more buyers to overcome this challenge, otherwise, the ssv.network prices will continue to decline.
The chart on a daily time frame reveals that the price of the SSV has risen by 119.19% since the start of the year and 29.47% in three months. The SSV price is trading under and in a tight range, and it requires a huge spike with momentum to break out of it.
The SSV coin price could start a remarkable rally if it crosses the $30 level, which is close to the resistance trendline. It could lead to new highs in the future and help it break the resistance level and grow to new levels from the current price. On the other hand, if it fails and drops, then it could fall to $15.
Earlier, the SSV price was exhibiting bullishness while sustaining above the major trend EMA’s.
However, the situation got swapped as the price met the supply range and plummeted, the SSV asset is exhibiting bearishness and is now, showing a bearish tendency as it slumps below the 20-day EMA.
Furthermore, depending on the seller’s increase, it could slump more and conquer holding EMA’s in the future session.
In addition, the SSV price is displaying bearish characteristics and the RSI and MACD are falling flawlessly with RSI at 46 and MACD at 0.0350 respectively, implying that the asset is losing momentum and can achieve new depths.
Summary
The SSV price is struggling to stay near the trendline resistance, which is a big obstacle for the asset. The asset price needs more buyers to overcome this challenge, otherwise, the ssv.network prices will continue to decline.
Furthermore, depending on the seller’s increase, it could slump more and conquer holding EMA’s in the future session.
Technical Levels
Support Levels: $15
Resistance Levels: $30
Disclaimer
In this article, the views, and opinions stated by the author, or any people named are for informational purposes only, and they don’t establish the investment, financial, or any other advice. Trading or investing in cryptocurrency assets comes with a risk of financial loss.




