
 Bitcoin
 ZKsync
 Pudgy Penguins
 Pearl
Pearl Quantus
 Starknet
 NEAR Protocol
- A huge surge in the trading volume of Fantom crypto has been recorded in the last 24 hours.
- During the last year, the trading price of the FTM crypto has advanced by 140%.
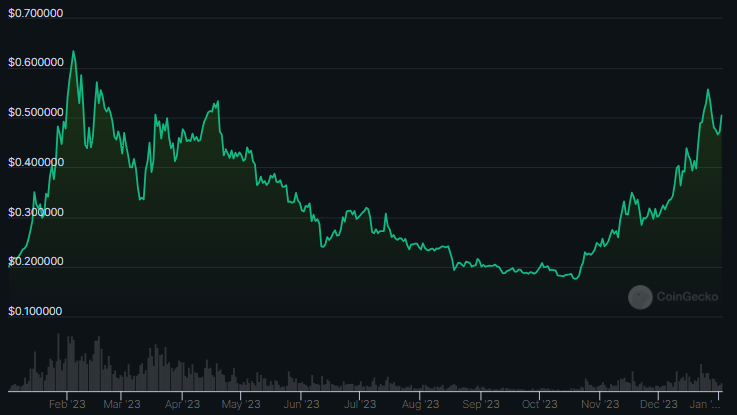
Fantom (FTM) is a DAG-based blockchain platform that aims to offer fast, scalable, and versatile solutions for various use cases. FTM is the native token that powers the network and enables staking, governance, payments, and fees. Fantom was founded by three experts in the tech and blockchain fields in 2018.
The market cap of the Fantom crypto has advanced by 5.2% in the last 24 hours and the current market cap of the crypto is $1.421B. The trading volume also had advanced by 46% ranking 54th as per volume.
The current traded volume of the Fantom crypto in the last 24 hours is $107.439M and the market cap ranking of the crypto is 58th. The volume/market cap ratio of the crypto is 8.18%.
Moreover, the current circulating supply of the Fantom is 88% of the max supply, resulting in a circulating supply of 2.803B FTM. Also, the current max supply of the crypto is 3.175B FTM and the fully diluted market cap of the crypto is $1.609B.
Fantom Derivatives Analysis
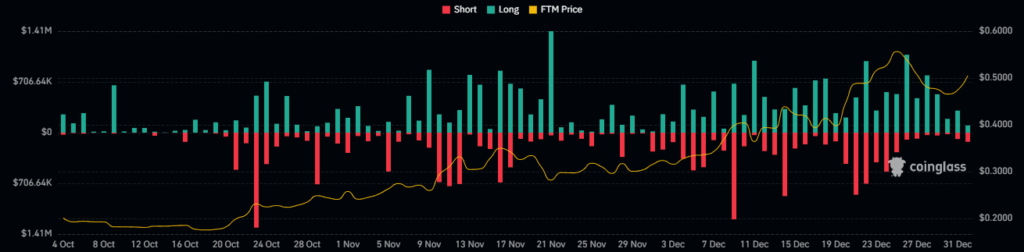
The Fantom crypto has witnessed a huge long liquidation of $110.65K and the short liquidation for the crypto is $48.58K. The derivatives volume of the crypto has slightly declined by 33%, resulting in a traded volume of $166.12M. Moreover, the open interest of the crypto has advanced by 1.21% and the open interest value of the crypto is $122.04M.
FTM Crypto Technical Analysis
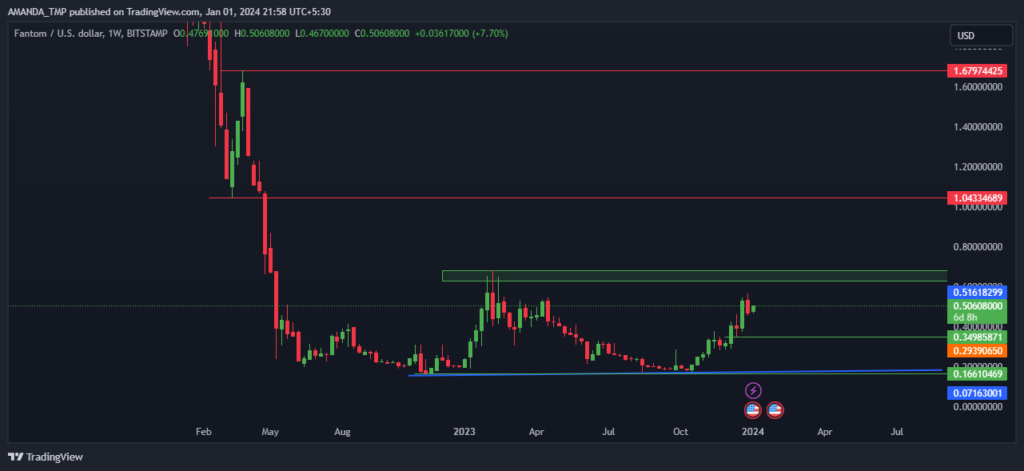
By forming bullish candlesticks on the chart, the FTM crypto price is trying to advance to higher levels and is forming a bullish structure. Following the most recent price action, the FTM crypto has made an inside candle on the weekly timeframe. Suppose the crypto breaks above the level of $0.569, we might see higher levels in the crypto.
FTM/USD Chart by TradingView
The Bollinger Band on the daily chart of the Fantom crypto is consistently advancing to higher levels. The price of the crypto is also taking support at the median line of the Bollinger band, which is forming a bullish pattern on the chart.
The following behavior of the indicator shows the possibility of a continuation of a trend in the crypto price.
The RSI is also following a bullish cycle and the RSI is currently trading at a level of $62.03 on the daily timeframe. As long as the price stays above the 50-level, the possibility of an advance in the price of the crypto is possible.
Conclusion
Based on the above analysis, FTM crypto has a strong chance of breaching the mark of $1.5 in the upcoming days. It has shown a bullish momentum, high trading volume, and positive indicators to break the resistance. The crypto has also formed a bullish pattern on the weekly chart, indicating a potential breakout.
Technical Levels
Support Levels: $0.16610 and $0.3498
Resistance levels:$1.0433 and $1.6790
Disclaimer
This article is for informational purposes only and does not provide any financial, investment, or other advice. The author or any people mentioned in this article are not responsible for any financial loss that may occur from investing in or trading. Please do your research before making any financial decisions.




