
 Crawlerpad
 Aerodrome Finance
 Zylo Ecosystem
 Wisp
Wisp Pearl
Pearl Sonic
Sonic Quantus
- The MATIC crypto price has declined by 3.1% in the last 24 hours.
- The trading volume for the MATIC crypto is also declining.
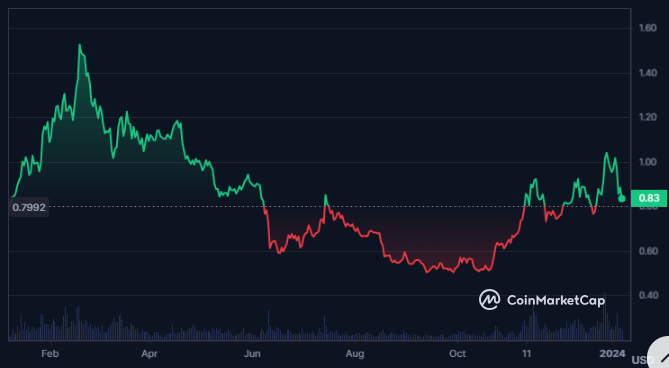
Polygon is an Ethereum scaling platform that uses MATIC tokens for fees and governance. It was founded by four Ethereum developers in 2017 and was launched in 2020. It hosts many popular DeFi applications on its fast and cheap sidechains.
The circulating supply of the Polygon crypto is 9.562 Billion MATIC, which is 95.63% of the total supply. Moreover, the max supply of Polygon is 10.0 Billion MATIC and the fully diluted market cap of the crypto is $8.355 Billion.
The market cap of MATIC has declined by 0.17% in the last 24 hours and it is currently $7.992 Billion. Additionally, the current market cap ranking of the crypto is 13th. Furthermore, the value of the traded volume of the crypto is worth $409.207 Million.
The market cap dominance of Polygon is 0.444% and the volume/market cap ratio of the crypto is 0.0669. This means that 6% of the total market cap of the crypto was traded in the last 24 hours.
Polygon Derivatives Analysis
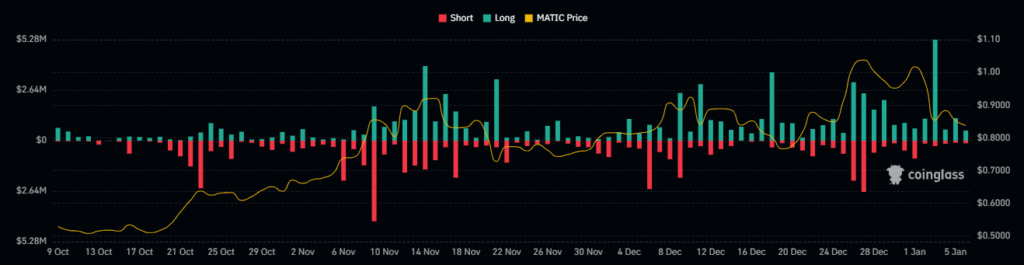
The trading volume of the Polygon crypto has declined by 25.5% in the last 24 hours. The traded value of the derivatives of the MATIC crypto is $598.08 Million. Moreover, the open interest of the crypto is trading flat, resulting in a value of $208.07 Million.
The long/short ratio of the crypto is 0.9619 followed by the last 24-hour liquidations. The long liquidation of the crypto is $837.51K and the short liquidation of the crypto is much less, resulting in a value of $207.36K.
MATIC Crypto Technical Analysis
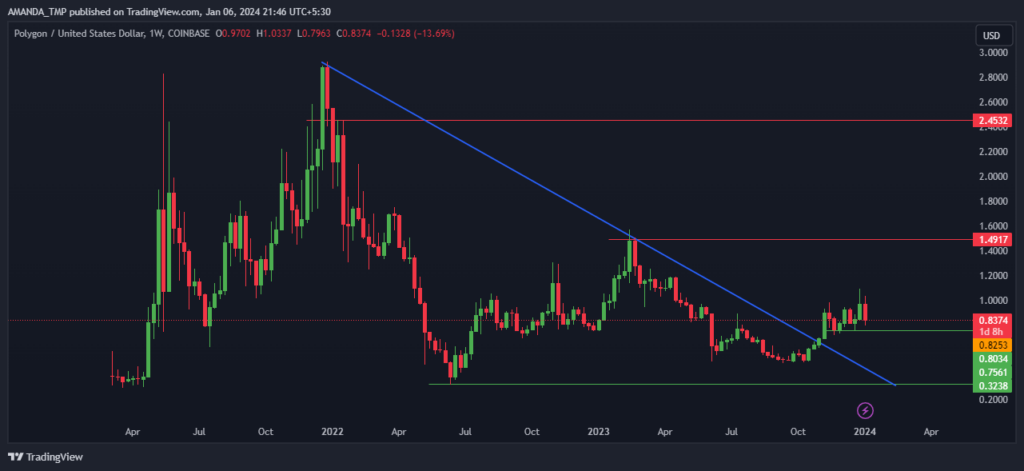
The price of the MATIC crypto has broken above the descending triangle pattern on the weekly timeframe and it is currently taking support at the breakout level. The price of the crypto is currently consolidating at the higher levels.
If the trading price of the MATIC crypto breaks above the last swing high, higher prices can be seen in future.
MATIC/USD Chart by TradingView
After hitting the higher band of the Bollinger Band indicator, the trading price of the MATIC crypto has declined below the median line, indicating profit booking on the daily timeframe.
The price has also declined below the 50-day EMA while the 50-day and the 200-day EMAs are forming a golden cross on the charts.
The RSI, on the other hand, is trading below the 50-level and it has slid below the 14-day SMA. This indicates a weakness in the price of the MATIC crypto.
Conclusion
Polygon is a fast and cheap Ethereum scaling solution that uses MATIC tokens. It has many DeFi applications and a high market cap. The MATIC price has broken above a triangle pattern and is consolidating for a breakout. Technical indicators point to a bullish trend reversal soon and if the price breaks above the last swing high, we might get to see an increase in the Polygon crypto price.
Technical Levels
Support Levels: $0.3200 and $0.8030
Resistance levels:$1.4900 and $2.4500
Disclaimer
This article is for informational purposes only and does not provide any financial, investment, or other advice. The author or any people mentioned in this article are not responsible for any financial loss that may occur from investing in or trading. Please do your research before making any financial decisions.




