
 Puffer
 Bitcoin
 ZKsync
 NEAR Protocol
 Walrus
 Pearl
Pearl Ondo
Ondo
- The TIA crypto price went up 14.6% in the last 24 hours.
- The current price of the Celestia crypto is 721% above the all-time low.
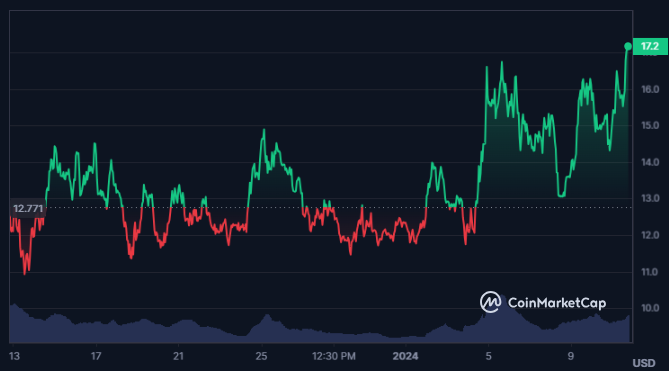
Celestia is a modular data availability network that enables anyone to launch their own blockchain. Celestia uses $TIA for fees, rollups, staking, and governance. Celestia solves the data availability problem with sampling and decouples execution from consensus.
The all-time high price of the Celestia crypto is $17.05 and it is currently trading close to its all-time high price. Also, the market cap of the Celestia crypto has advanced by 16.9% in the last 24 hours and the current value is $2.685 Billion.
The trading volume of the TIA crypto further has advanced by 25% in the last 24 hours and the traded value for the crypto is $500.686M. Also, the circulating supply of the Celestia is 156.605 Million TIA.
The current volume/market cap ratio of the crypto is 18.78% and the max supply of the Celestia is undefined. Moreover, the fully diluted market cap of the crypto is $17.46 Billion. Celestia crypto’s market cap dominance value is 0.142% in the whole crypto market.
Celestia Derivatives Analysis
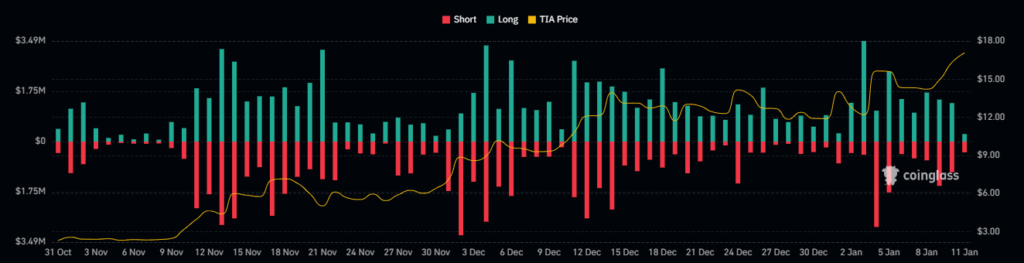
The derivatives trading volume of the TIA crypto has declined by 9.2% and the open interest has advanced by 17.2% valuing $173.00 Million. Also, the long/short ratio of the Celestia crypto is 0.9818 and the long liquidation for the crypto is $1.04 Million. Moreover, the short liquidation of the crypto is slightly higher resulting in $1.09 Million.
TIA Crypto Technical Analysis
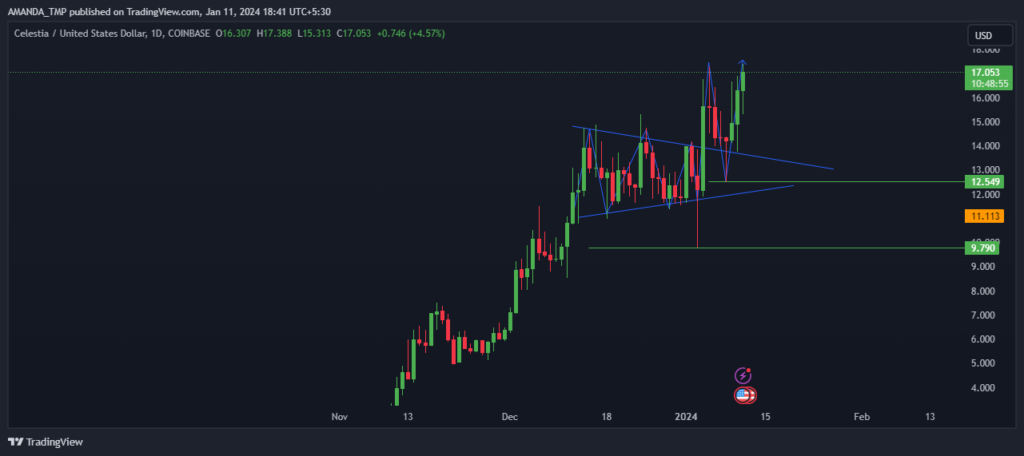
The price of the TIA crypto has been advancing steadily to higher levels which led to the formation of the symmetric triangle pattern. The price of the TIA crypto further broke above this pattern.
Since the breakout, the TIA crypto price further has advanced by 20% and has shown strong bullish price action on the charts.
TIA/USD Chart by TradingView
The price of the TIA crypto is consistently advancing to higher following a clear uptrend. The 50-Day and the 200-Day EMAs are consistently advancing to higher levels with the price of the crypto. The EMAs are also trading in a golden cross on the 4 hour chart.
The MACD on the chart is also giving a buy signal. The MACD line is trading above the signal line and both have advanced above the zero level on the chart.
Conclusion
TIA is a high-potential crypto that powers Celestia, a modular data availability network. TIA has surged by 14.6% in the last 24 hours, reaching close to its all-time high. TIA has a strong market cap, volume, and derivatives performance. TIA has a bullish technical outlook, with a breakout, a golden cross, and a MACD buy signal.
Technical Levels
Support Levels: $9.700 and $12.500
Resistance Levels: $18.00 and $20.00
Disclaimer
This article is for informational purposes only and does not provide any financial, investment, or other advice. The author or any people mentioned in this article are not responsible for any financial loss that may occur from investing in or trading. Please do your research before making any financial decisions.




