
 NEAR Protocol
 Bitcoin
 Puffer
 Hyperliquid
 ZKsync
 Pudgy Penguins
 Pearl
Pearl
- In the last 24 hours, the trading price of the LINK crypto has increased by 4.8%.
- As per Coincodex, the sentiment of the Chainlink crypto is bullish.
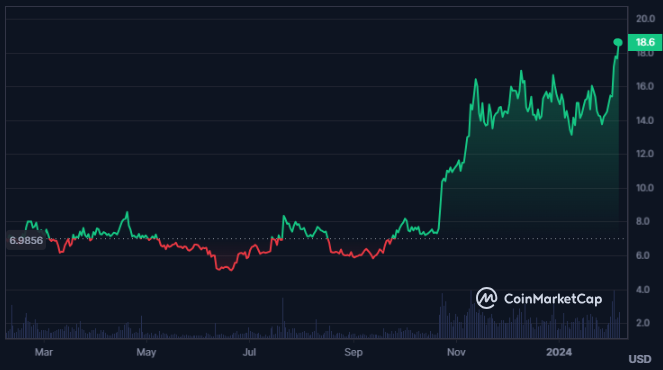
Chainlink is a network of oracles that link real-world data to smart contracts on Ethereum. LINK is the token that powers the network and rewards the providers. Chainlink enables various decentralized applications with secure and reliable data. It was founded by Nazarov and Ellis in 2017 with the Web3 Foundation’s support.
The circulating supply of the Chainlink crypto is 587.099 Million LINK and the max supply is 1.0 Billion LINK. Additionally, the fully diluted market cap of the crypto is $18.61 Billion and the volume/market cap ratio of the crypto is 7.99%.
The market cap of Chainlink has increased by 5.25% in the last 24 hours and the trading volume has also risen by 52.3%. This results in a traded volume of $882.86M.
Moreover, the market cap is $10.932B which makes it the 11th largest cryptocurrency in the market. Furthermore, the crypto has a market cap dominance of 0.66%. Additionally, the supply inflation of the crypto is high at 15.57%.
Chainlink Crypto Derivatives Analysis
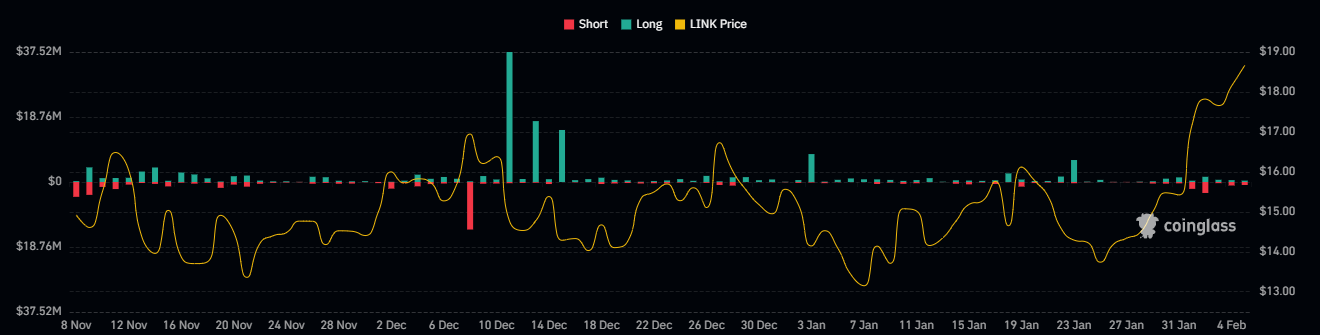
The Chainlink crypto is trading with a long/short ratio of 0.9693 which has resulted in a higher short liquidation. Furthermore, the short liquidation of the crypto is worth $1.81 Million and the long liquidation is $635.05K.
The open interest of the crypto has increased by 60.5% in the last 24 hours, resulting in $579.47 Million. The derivatives trading volume has also increased by 60.5% rto $1.68 Billion.
LINK Crypto Technical Analysis
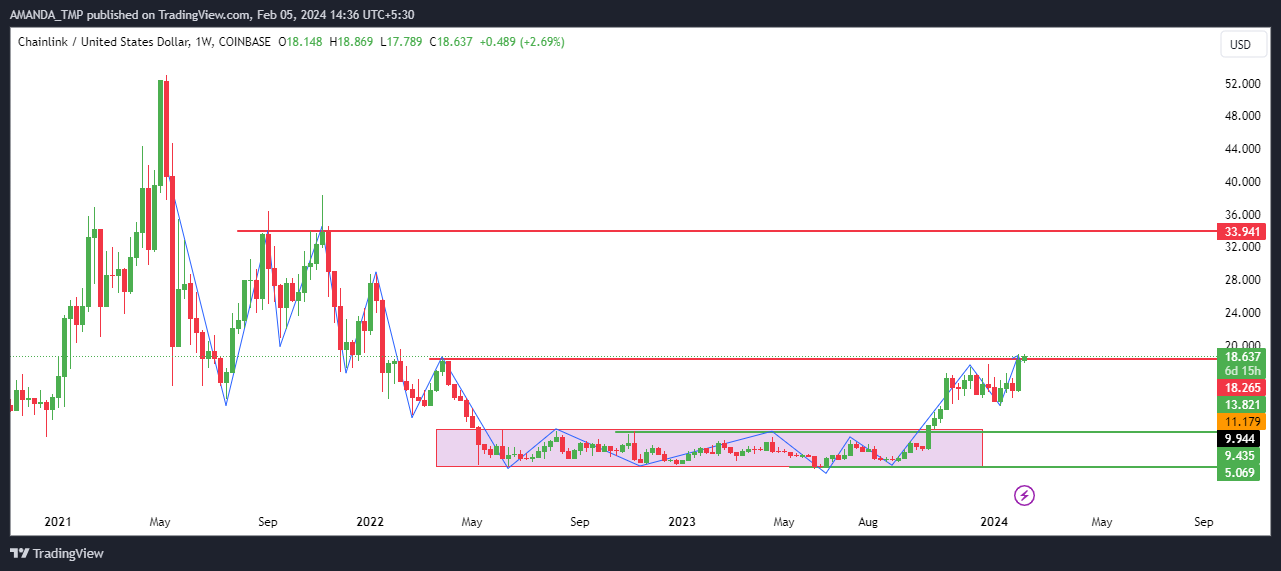
The LINK crypto price has broken out of the long-term consolidation and the price is consistently rising to higher levels and there is the formation of a higher high price structure.
After rising to higher levels, the price took a pause for a while and has again broken out above the last swing high. This behavior shows that the buying momentum is strong.
LINK/USD Chart by TradingView.com
The crucial EMAs on the daily chart are forming a golden cross and the price of the crypto is consistently rising to higher levels. Furthermore, the price is situated above the 50-day and the 200-day EMAs.
The MACD is giving a strong buy signal as the MACD line is situated above the signal line. It has formed strong bullish blocks on the daily chart. The RSI has risen to the overbought zone and is situated above the 14-day SMA line. This behavior of the indicator shows strength in the price.
Summary
LINK has a high market cap, trading volume, and open interest. It has broken out of consolidation and is forming higher highs. The technical indicators show strong buy signals and bullish momentum. LINK is set to skyrocket to new highs with the current momentum.
Disclaimer
This article is for informational purposes only and does not provide any financial, investment, or other advice. The author or any people mentioned in this article are not responsible for any financial loss that may occur from investing in or trading. Please do your research before making any financial decisions.




