
 Pearl
Pearl Bitway
 Pudgy Penguins
 Optimism
 Walrus
 NEAR Protocol
 Pons
Pons
- The SOL coin price has given a breakout from the bullish flag pattern at $96.91.
- The technical analysis of Solana‘s native coin’s price suggests buy signals.
Solana (SOL) is a functional open-source project that facilitates decentralized app (dApp) creation. It works on blockchain technology to improve scalability by introducing PoH and PoS blockchain consensus. The Solana Foundation has announced that 489 Million tokens will be released in circulation.
Past Performance of the SOL Coin
The SOL coin price has given a return of over 900% in the previous year. The price has consequently shown positivity after retesting the $78.14 level early this year. That shows the buyers are unwilling to close their long positions in the current session.
Alternatively, the whole scenario caused a bullish sentiment in the SOL coin price. In the weekly timeframe, the price is more likely to form a cup-and-handle pattern with the help of the $77.60 support level. It would be a signal for the next potential buying.
Similarly, in the daily chart, the SOL coin price has given a breakout from the bullish flag pattern. It is currently heading toward the initial resistance of $126.40 level. As per the volume and strength, it may give a breakout soon from that level.
According to CoinMarketCap, the SOL market capitalization has ranked 5th among all the 8,814 active cryptocurrencies. The 24-hour traded volume is more than 14%, totaling $2,640,886,578. Additionally, the SOL coin’s all-time high price is at $260.06.
Technical Analysis of the SOL Coin
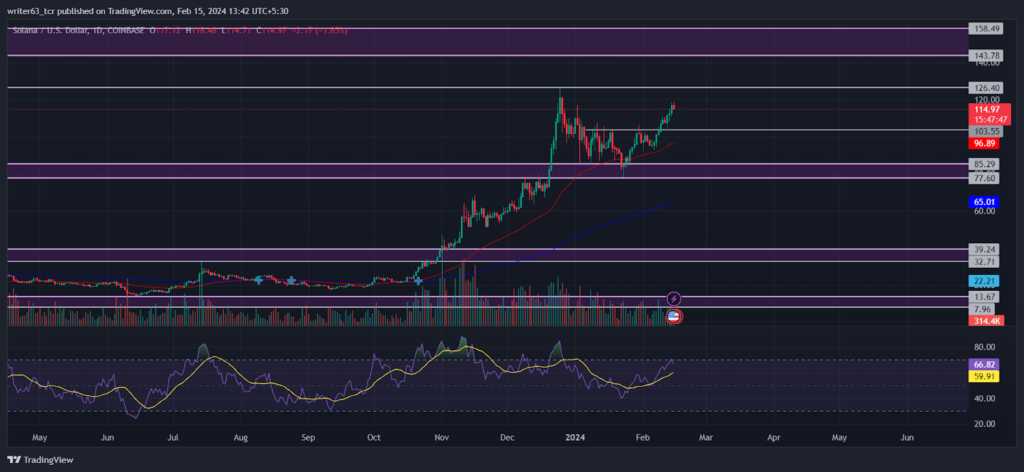
The SOL crypto price has rebounded by the 50-day EMA, resulting in the breakout of the bullish flag pattern. It got strong support from the 50-day EMA since the bullish crossover happened in October 2023. The current price is moving in a strong uptrend.
Conversely, the price has shown strong buying on the $77.60 level on December 20, 2023. Afterward, the Solana price did a bullish pullback, and the strong buying level played an essential role in continuing the price trend.
The price is heading toward the $126.40 resistance level, followed by the $103.55 last pullback. The resistance level is not strong enough to hold the price down. If the price breaks and sustains above that level, it may rise toward the $158.49 level.
Furthermore, the relative strength index (RSI) is moving neutral compared to the price chart. It indicates neutrality over the current market price as per RSI. It is sloping at the 70-mark upper band.
Conclusion
Overall, the SOL coin price has given good returns in the last year. It is trading in an uptrend, providing a breakout from the bullish flag pattern at the $96.91 level. The 50-day EMA strongly supports the current market price. Therefore, the price prediction will be bullish. The SOL price is moving to give a breakout of $126.40. It may reach $158 and $179 levels if it sustains above that level.
Technical Levels
- Resistance Levels: $126.40, and $158.49
- Support Levels: $96.91, and $77.60
Disclaimer
The views and opinions stated by the author, or any people named in this article, are for informational purposes only. They do not establish financial, investment, or any other advice. Investing in or trading crypto assets comes with the risk of financial loss.




