
 NEAR Protocol
 Bitcoin
 Puffer
 Hyperliquid
 ZKsync
 Pudgy Penguins
 Pearl
Pearl
- The POND price is trading at $0.02062, and the price is trying to rise from trendline support and has been in a higher high and low structure.
- It plummeted by 0.49% in market value and is up 42.74% in terms of trading volume in the last 24 hours.
The POND token functions within the Marlin network as a means to incentivize members to contribute network bandwidth and participate in governance tasks. It’s employed to delegate to Marlin nodes and serves as a reward for the proper operation of the relay network.
The Marlin token has performed well in the last month, increasing by 38.76% and optimizing by 153.60% in the last six months. Marlin Network (COINBASE: POND) has a positive year-to-date return of 39.33% and a positive one-year return of 70.76%.
POND crypto plummeted by 0.49% in market value and rose by 42.74% in trading volume over the last 24 hours, as per the CoinMarketCap, a crypto data analysis website. Its market value is $165,977,486 and its trading volume is $4,832,969. There are 8,087,375,977 POND in circulation.
Marlin Price Technical Analysis In The 1-D Timeframe
Marlin price showed an upward trend for the past three months, increasing by 99.80% during this period.
At the time of publication, the POND price is trading at $0.02062, and the price is trying to rise from trendline support and has been in a higher high and low structure. If more volume adds up then breakout might drag the price towards new highs.
Therefore, the Marlin crypto price could continue to move upwards and reach the nearest resistance level at $0.02800 and $0.03500.
However, if the POND price fails to sustain the current level and declines, then it might hit the nearest support levels of $0.01700 and $0.01400.
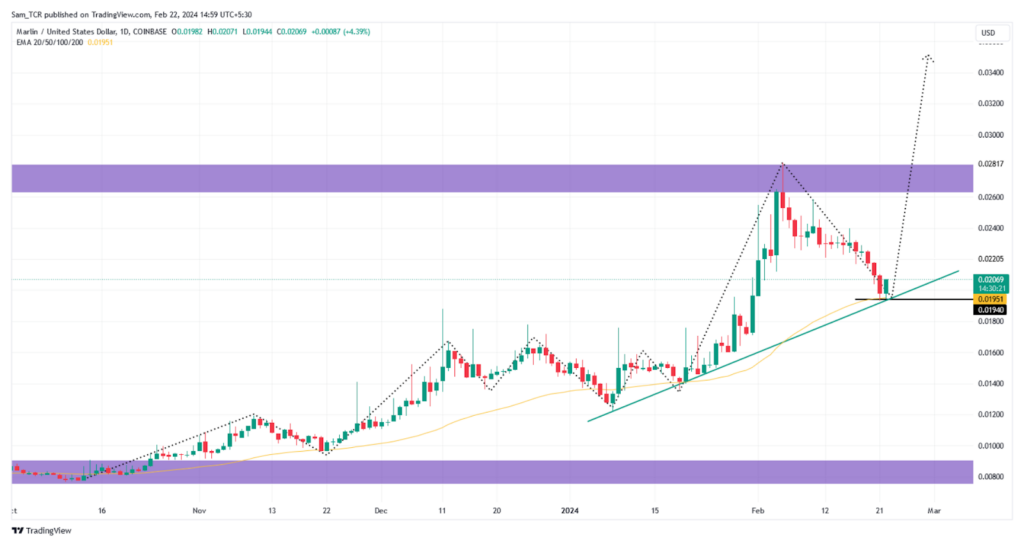
At the time of publishing, the Marlin price (COINBASE: POND) is trading above the 50-day EMA (exponential moving average), which supports the price trend.
Hence, Marlin’s price prediction estimates the prices to move upwards, indicating a bullish outlook over the daily time frame chart for its price.
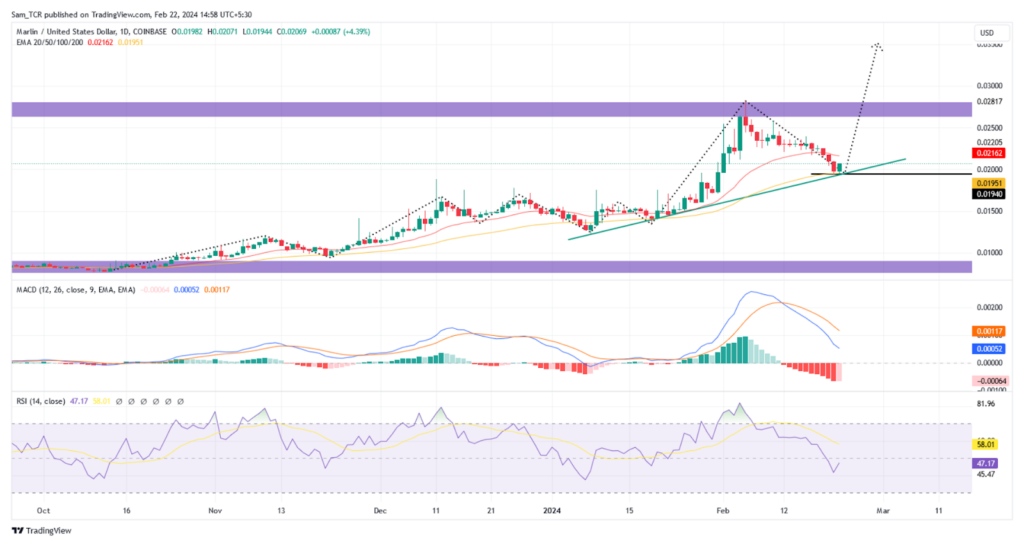
The MACD line at 0.00052 and the signal line at 0.00117 are above the zero line and are in bullish territory in the MACD oscillator, suggesting bullish signals. The current value of the RSI is 46.94 points and the 14-day SMA is at 57.99 points, and the curve shows a U-turn and indicates bullish sentiments.
Summary
The price action shows a bullish perspective as it is in an overall uptrend structure and making higher highs on the daily chart. It also came into sight that the price has been taking support from the trendline.
Technical Levels
Support Levels: $0.01700 and $0.01400
Resistance Levels: $0.02800 and $0.03500
Disclaimer
In this article, the views, and opinions stated by the author, or any people named are for informational purposes only, and they don’t establish the investment, financial, or any other advice. Trading or investing in cryptocurrency assets comes with a risk of financial loss.




