
 Bitcoin
 NEAR Protocol
 Pudgy Penguins
 Puffer
 ZKsync
 Bitway
 Pearl
Pearl
- The GRT token price has given a breakout of the $0.232 resistance.
- Moving averages are indicating strong buying signals in the current trading session.
The Graph (GRT) is an indexing protocol that works to bring reliable decentralized public infrastructure to the main market. The protocol examines data for networks like Ethereum and IPFS. It powers many applications in both DeFi and the broader web3 ecosystem.
The Graph has built an open data layer on top of blockchains in which indexers can run their own Ethereum archive nodes to run Graph nodes.
GRT Token Price Showing Positive Returns Since the Last Year
On October 20, 2023, the GRT token price rallied toward the $0.141 resistance level. The price surged almost 100% by the formation of impulsive bullish candles. This rally played a significant role in changing the character, which is also reflected in the sentiments.
Subsequently, the price took a short pullback at the $0.120 support level, which retraces more than 60%. Again, It surged 94% to the $0.232 resistance level. It formed multiple swing high and swing low structures with a decisional demand level at $0.141.
The buyers closed their positions when the GRT token price reached the $0.232 resistance level. It resulted in a short-term fall on the $0.141 demand level. The price also crossed below the 50-day EMA, which reflected neutrality in the movements.
However, the price has gotten a very strong bullish reaction from that demand level. It is still in an upward movement. The 24-hour trading volume of the GRT token is at $320 Million, ranked 27th among the 8,841 active cryptocurrencies.
Technical Analysis of the GRT Token Price
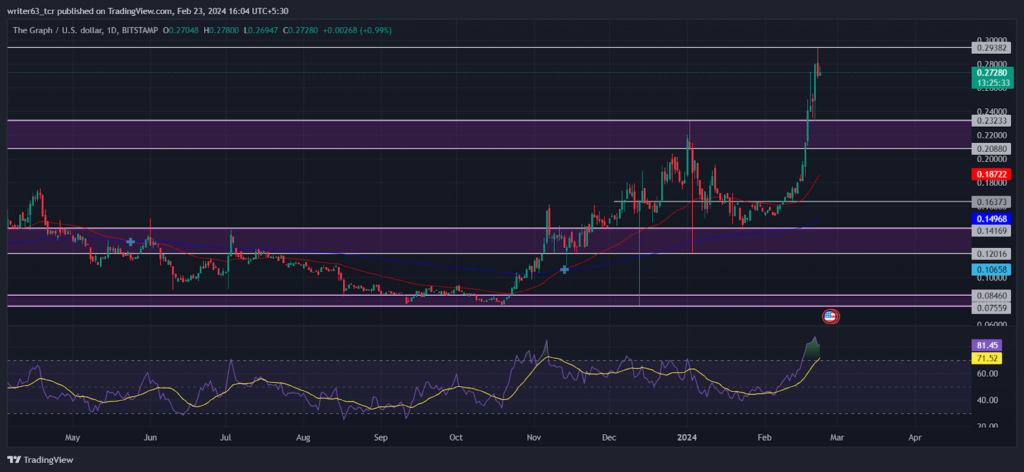
The current GRT token price is moving above the 50-day and the 200-day EMA, reflecting a bullish trend. Both the EMAs had a bullish crossover at the $0.106 level, making this trend even stronger. The 50-day EMA is moving at $0.187, and the 200-day is moving at $0.149.
The GRT token price has strongly reacted from the $0.141 demand level. Previously, it created a resistance level of $232 on January 2, 2024, which was broken by this rally. The price formed strong bullish candles, which reflects the buyer’s sentiments.
At press time, the price is trading at the $0.271 level. In the previous trading session, it faced resistance from the $0.293 level, which is keeping the price below. The GRT token price needs a bullish correction; then, it will continue proceeding.
The relative strength index (RSI) moves in the overbought region above the 70-mark upper band. It indicates the current price is too high to be bought. The RSI is sloping at 81.27 above the signal line.
Conclusion
The GRT token price is performing in an uptrend. The 50-day and the 200-day EMA are also moving below. Recently, the GRT token price delivered 100% in a single rally. Currently, the price is trading at $0.271, facing resistance from the $0.293 level. The price may break above the $0.293 level if it makes a bullish correction on the $0.208 support level.
Technical Levels
- Resistance Levels: $0.293 and $0.410
- Support Levels: $0.208 and $0.141
Disclaimer
The views and opinions stated by the author, or any people named in this article, are for informational purposes only. They do not establish financial, investment, or other advice. Investing in or trading stocks and crypto comes with a risk of financial loss.




