
 Crawlerpad
 Aerodrome Finance
 Zylo Ecosystem
 Wisp
Wisp Pearl
Pearl Sonic
Sonic Quantus
- Buyers and investors are keen to lift the price to the $50 hurdle.
- Injective protocol price has surged by 104% since December.
On a wider time frame, the Injective (INJ) price has been in a bullish trend and has surged by 344% since October. The bullish trend was disturbed near the $45 hurdle and dropped by 20% in a few days. Injective crypto price attempted twice to sustain at the $45 mark but sellers were strong and pulled down the price by 29% in just two weeks. Since then, the INJ price hasn’t managed to surpass the $40 mark.
As per the technical chart, the INJ crypto price is showing bearish momentum by not reaching the last swing highs. Recently, the INJ price has faced resistance from the $40 mark and has declined by 15.65% in the last five days.
A bearish crossover has been generated between the RSI and RSI-based moving average which showcases the bearish trend. The INJ price has slipped below the 50-Day moving average.
Injective Price Has Formed Flag and Pole Pattern
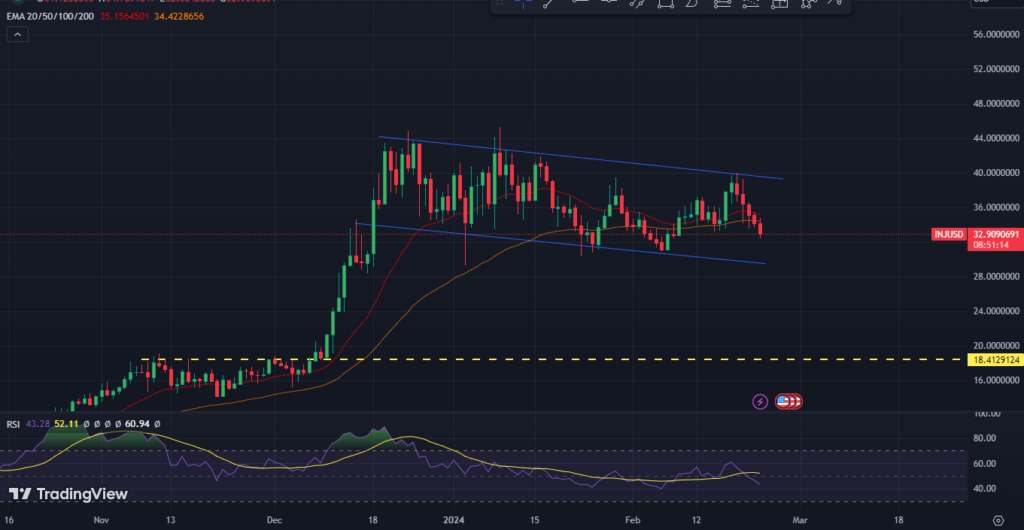
The current market price of INJ is $32.82 which has declined by 3.83% in the last 24 hours. The Injective Protocol price has formed a flag and pole pattern on a daily time frame. Currently, the price has faced resistance from the upper trendline and heading for the lower trendline.
The price has slipped below the moving averages which indicates the selling pressure for the last few days. As per the price action, the INJ crypto price is ready for new lower lows.
As per the technical analysis, the INJ price may take support at the $29.50 level because last time the price took a pullback and surged by 44% in just 4 days. If the price takes support on the $29.50 and rises, it may consolidate for some more time in the channel.
But if the INJ crypto price fails to defend the $29.50 and slips below the flag and pole pattern, sellers may dominate and it may lead to a bearish trend.
INJ Price Prediction On 4-H Timeframe
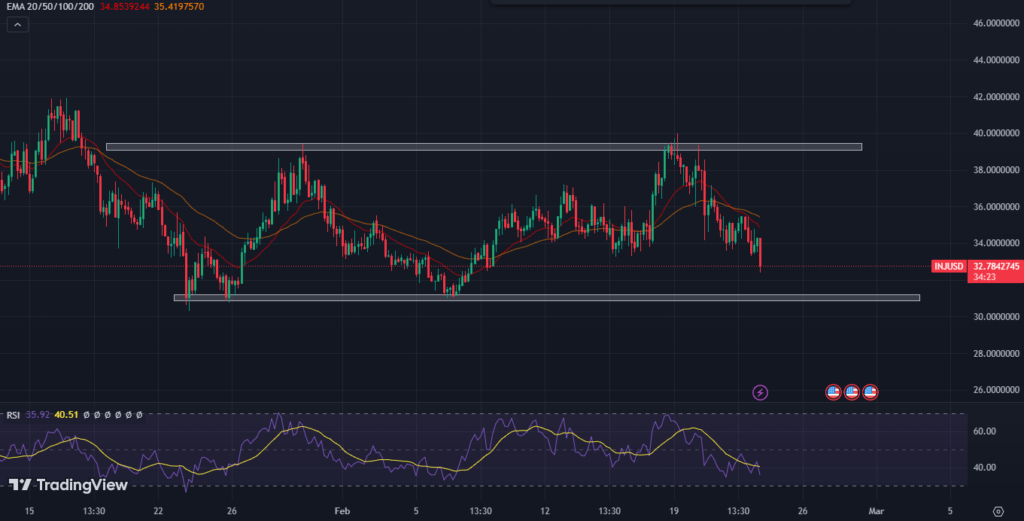
In a 4-H time frame, the Injective Protocol price has been consolidating in a parallel channel and it is heading for the support level. If the price breaks down from the channel and is sustained, a bearish trend can be expected.
On the other hand, if the price takes support on the trendline and manages to defend the $31 level, buying momentum can be initiated but if the price surpasses the 20-Day moving average, it may easily approach the $40 hurdle.
Conclusion
Based on the technical analysis, the INJ price is currently in a bearish trend and has faced resistance from the $40 mark. The price has formed a flag and pole pattern and is currently heading towards the lower trendline. If the price fails to defend the $29.50 level, a bearish trend may dominate.
Technical Levels
Support: $31.00 & $18.40
Resistance: $39.00 & $44.00.
Disclaimer
This article is for informational purposes only and provides no financial, investment, or other advice. The author or any people mentioned in this article are not responsible for any financial loss that may occur from investing in or trading. Please do your research before making any financial decisions.




