
 Puffer
 ZKsync
 Bitcoin
 NEAR Protocol
 Pearl
Pearl Quantus
 Sui
Sui
- The FRAX token price faced resistance from the $1.0580 level.
- The 24-hour trading volume of the Frax crypto has increased by 319.96%.
Frax (FRAX) is a unique design stablecoin driven by the community. It is the first fractional-algorithmic stablecoin system. The protocol has two tokens, in which FRAX is a stablecoin targeting a tight band around $1/coin, and FXS is the governance token. It is an entirely decentralized protocol with governance on-chain. FXS is issued over 60% of the supply to liquidity providers and yield farmers.
The FRAX Token Price Reflects Neutrality in Returns
FRAX token price formed regular candles from the $0.9369 support level. Earlier, the price made a strong rejection candle on that level. The regular candles surged 12% to the $1.0479 resistance level, an important upper range.
Subsequently, the FRAX token price made a bullish correction to the $0.9663 level, resulting in a 13% quick spike above the $1.0580 resistance level. The FRAX price has performed quick bullish spikes multiple times from the $0.9663 level.
According to the price behavior, crypto traders are trading the FRAX token price in a quick execution method. They are buying at the key points and executing on the fixed level. This behavior resulted in the formation of quick spikes on both sides.
Currently, FRAX has formed a bearish rejection candle. Alternatively, the current price is performing 54.47% below its all-time high level. The current market capitalization of the FRAX stands at $648 Million, ranked 214th among all cryptocurrencies.
Technical Analysis of the FRAX Token Price
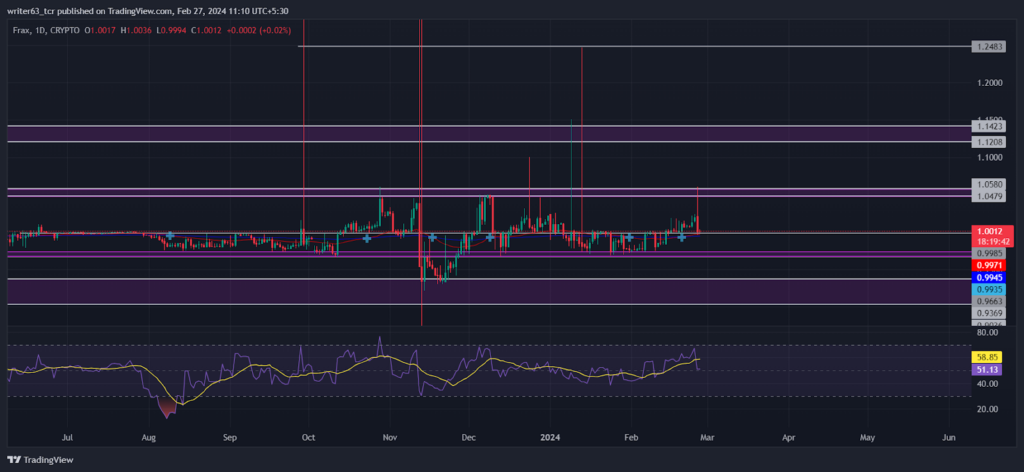
The 50-day EMA and the 200-day EMA have made a bullish crossover, indicating a positive signal. However, both the EMAs have been moving in the middle of the trend, which reflects a neutral perspective on the FRAX token price.
FRAX token price has given a strong bullish reaction multiple times from the $0.9663 level. It makes that level a solid support for the price. The price faced strong selling pressure from the $1.0580 level in the last two trading sessions.
Subsequently, the price is moving toward the $0.9663 level. If it closes below that level, a negative quick spike can be expected below $0.9036. However, the price can take another support at the $0.9663 level, making a bullish quick spike.
On the other side, the relative strength index (RSI) slope is at the 50-mark middle band, reflecting neutrality in the momentum. The RSI slope is moving parallel to the spot price chart.
Conclusion
According to the technicals, the FRAX token price is moving in a neutral trend. The price made multiple spikes on both sides, reflecting the quick execution of targets. At press time, the FRAX token price faced resistance from the $1.0580 level. It is moving toward the $0.9663 strong support level. If the price closes below that level, a negative spike can be expected below $0.9036. However, the bullish spike should get a strong reaction from the $0.9663 level.
Technical Levels for Regular Candles
- Resistance Levels: $1.0580 and $1.1423
- Support Levels: $0.9663 and $0.9036
Disclaimer
The views and opinions stated by the author, or any people named in this article, are for informational purposes only. They do not establish financial, investment, or other advice. Investing in or trading stocks and crypto comes with a risk of financial loss.




