
 Dacity Coin
 streamoors
 Celestia
 Injective
 Quantus
 Pudgy Penguins
 Pearl
Pearl
- An increase of 2.12% has been observed in the Osmosis price during the intraday trading session.
- Technical indicators summary suggested a bullish signal in the current phase.
- The trading volume has reached $27 Million, rising 40.28% in the last 24 hours.
Osmosis (OSMO) is a decentralized exchange (DEX) platform for Cosmos that offers non-IBC assets bridged from the Ethereum and Polkadot ecosystems. Primarily, the platform uses balancer-style pools, but now, it is moving toward a more sustainable concentrated liquidity model. As an appchain DEX, Osmosis has superior control over the full blockchain stack compared to other DEXs.
OSMO Returns have Exceeded 400% During the Six-Month Session
In October 2023, Osmosis price experienced a rise of 14.81% from the $0.3135 support. The favorable situation became intriguing for crypto cruisers and traders. They assembled in November 2023 and surged cryptocurrency by over 100%.
However, OSMO crypto didn’t perform well in January 2024. It only reflected 6.36% returns during that month. This could be one of the reasons behind the negative fall in the price over the last three months.
The maximum supply of OSMO tokens is capped at 1.00 billion, with a total diluted valuation of $1.35 Billion. 65.13% of the maximum supply of tokens is circulating in the market, which is hardly at 651 million. The cryptocurrency’s current market capitalization stands at $882 Million, ranking 112th out of 9,531 active cryptocurrencies.
Price to Volume and Social Dominance Analysis
In December 2023, the cryptocurrency’s buzz covered over 0.447% dominance across social media platforms. This positively impacted the price, which increased by over $1.81 over two months. On the other side, the volume is showing stability at $40.00 Million, and the social dominance is rising in the current sessions.
Technical Analysis Of Osmosis (OSMO) Price
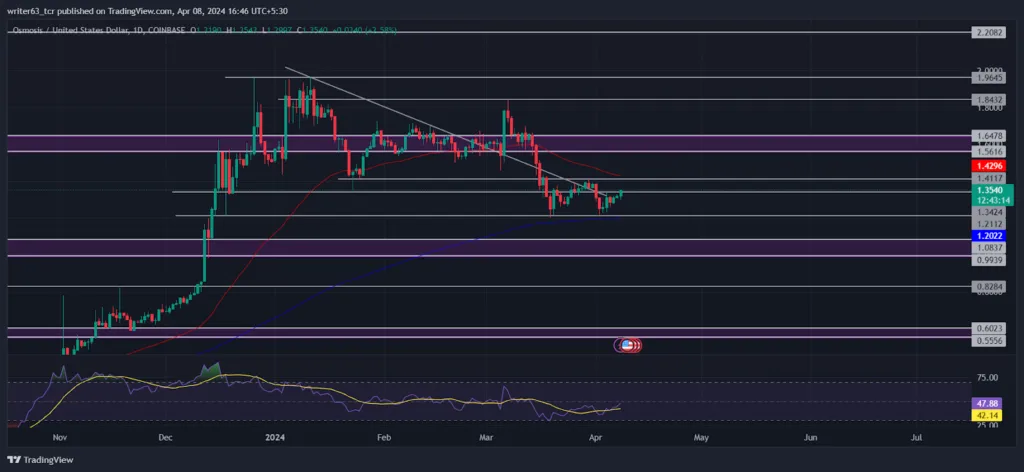
Osmosis price slipped between the key exponential moving averages, reflecting uncertainty in the current phase. The 200-day EMA is acting as a dynamic support for the price. The bullish trend cannot be confirmed unless the price exceeds the 50-day EMA.
OSMO price has experienced a fall of 34% from the $1.84 resistance level. The price is forming a double bottom pattern from the $1.21 bullish point of interest (POI). Regarding the market technicals, if the price closes above $1.41, it may reach the $1.56 supply level. In addition, a significant bullish change in crypto price may occur when the price closes above the $1.64 bearish POI.
Moreover, the relative strength index (RSI) reflects a bullish divergence in the price momentum. It indicates the increasing buying pressure in the current trading sessions. The RSI is moving at 47.60 above the signal line.
Summary
Since January 2024, Osmosis price has been facing profit bookings from the $1.96 resistance. OSMO is experiencing a short-term downtrend. Technical indicators suggested a positive signal in the current phase. The price can reach $1.56 if the price closes above $1.41. However, a short-term fall to the $0.99 bullish POI can be seen if the price slips below $1.21.
Technical Levels
- Resistance Levels: $1.56 and $1.84
- Support Levels: $1.21 and $0.99
Disclaimer
The views and opinions stated by the author or any people named in this article are for informational purposes only. They do not establish financial, investment, or any other advice. Investing in or trading crypto or stock comes with a risk of financial loss.




