
 NEAR Protocol
 Bitcoin
 Puffer
 Hyperliquid
 ZKsync
 Pudgy Penguins
 Pearl
Pearl
- Optimism crypto price has just exceeded the 20-day EMA.
- OP price has lost around 50% from its all-time high.
In a weekly time frame, the Optimism crypto price chart displays that the price is rising by taking support from the trendline. Since June 2022, the Optimism crypto price has been rising by taking support on the trendline, but this time, bulls seem to be strong and may not wait to touch the trendline.
Optimism has performed negatively since the second week of March and slipped below the 20-day EMA in the weekly timeframe. A buying signal was generated from mid-April, and the price was extended to the key moving average.
However, the buyers failed to overcome the 20-day EMA. After short-term selling pressure, buyers participated, and the chart structure formed a hammer candlestick.
Will It Achieve $5 Mark After Breakout?
$Op
— World Of Charts (@WorldOfCharts1) May 17, 2024
Forming Bullish Pennant Incase Of Breakout Expecting Move Towards 5$ #Crypto #Op pic.twitter.com/8NynYfEu1Y
According to the source on X, the Optimism crypto price is near the crucial breakout level. If it triggers a breakout and the chart structure attracts the buyers, it may achieve the $5 mark in the next few months.
Optimism Price Forecast Over 1-D Timeframe
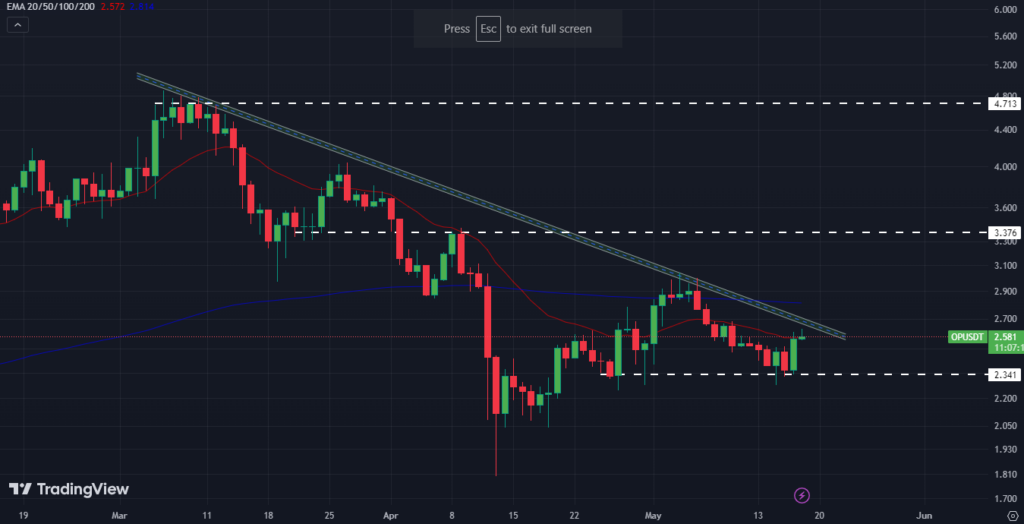
When writing, the Optimism price traded at $2.57, up by 0.31% in the past 24 hours. The market capitalization is $2.82 Billion, and the 24-hour trading volume is $265.82 Million. The circulating supply is 1,086,889,963 OP, and the fully diluted market cap is $11.08 Billion. The total and maximum supply is 4,294,967,296 OP.
On a daily time frame, the Optimism crypto price has been falling by facing a resistance line. At press time, the Optimism price has extended to the trendline with bullish momentum. Suppose the trading volume increases, which may help trigger a breakout.
If the OP crypto price triggers a breakout from the trendline and sustains over the 200-day EMA, buyers may look for the $3.50 mark. Suppose the buyers remain strong, then the price may record a new all-time high.
Suppose the Optimism crypto price fails to trigger a breakout, and then it will keep declining by facing resistance from the trendline.
According to the technical indicators, the digital asset price traded below the key moving averages at the time of writing, indicating a bearish trend. However, the RSI is 49, and a bullish crossover has been generated between the RSI and the RSI-based moving average.
Conclusion
The technical indicators suggest a potential bullish momentum, but the price would need to sustain over certain key levels to reach new highs. The Optimism price is near the crucial breakout level, and keeping an eye on price movement and volume changes is important.
Technical Levels
If the OP price turns bullish, the momentum could be interrupted near the $3 and $4 levels. On the other hand, the price may take support on the $2.02 and $1.20 marks.
Disclaimer
This article is for informational purposes only and provides no financial, investment, or other advice. The author or any people mentioned in this article are not responsible for any financial loss that may occur from investing in or trading. Please do your research before making any financial decisions.




