
 Bitcoin
 Ondo
Ondo NEAR Protocol
 Walrus
 Pearl
Pearl Pons
Pons Ethereum
- Solana crypto has witnessed a surge in its trading volume.
- The SOL price has advanced by 759% in the last 1 year.
Solana is a high-performance blockchain that uses proof-of-history (PoH) and delegated proof-of-stake (dPoS) to achieve high scalability and decentralization, processing up to 65,000 transactions per second.
The SOL token is used for transaction fees, smart contract interactions, and staking, with additional use cases in decentralized applications.
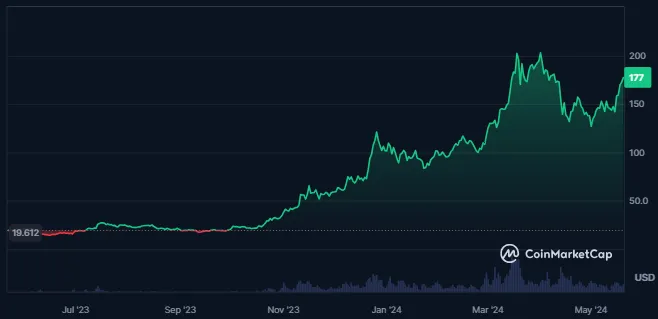
Solana crypto has medium liquidity based on its market cap, as the crypto’s volume/market cap ratio is 3.63%. The traded volume of the crypto further has advanced by 38% over the last 24 hours.
Solana Crypto Derivatives Analysis
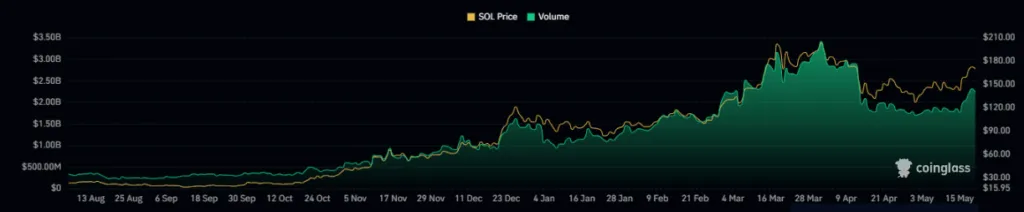
The open interest in the SOL crypto has advanced by 3.8% over the last 24 hours, which shows an increase in the number of open positions in the crypto.
The derivatives volume for Solana has also witnessed a surge of 59%, resulting in a traded value of $7.03B. Moreover, the long/short ratio for the crypto is 0.9798.
Despite the surge in the trading activity, the liquidation shows uncertainty in price as the long liquidation for the crypto is worth $4.60M while the short liquidation values $4.36M.
SOL Crypto Technical Analysis
The SOL cryptocurrency has consistently found support at a dynamic trendline for over three months, maintaining its position above this key level.
This trendline has served as a crucial support level, bolstering investor confidence in the stability of SOL’s price.
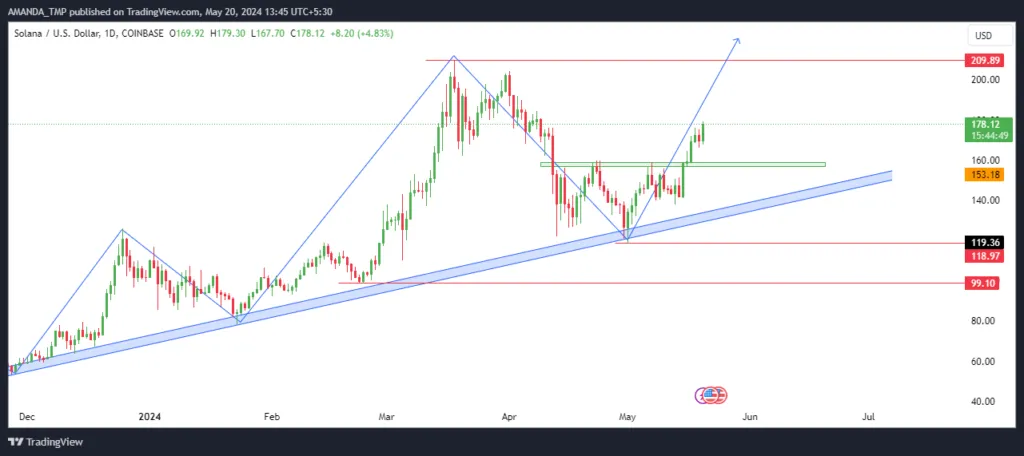
On April 30, 2024, SOL’s price reached this long-term dynamic support trendline. At this critical juncture, the price action resulted in the formation of a bullish candlestick pattern on the chart. This technical indicator suggested a potential upward movement in SOL’s price.
Following the formation of the bullish candlestick pattern, SOL experienced a significant surge in its trading price. Since touching the support level, the cryptocurrency’s price has increased by 30%, indicating strong bullish momentum and investor optimism.
SOL/USD Chart by TradingView
The daily chart of SOL cryptocurrency indicates a robust bullish sentiment, highlighted by the 50-day and 200-day EMAs forming a golden crossover. Additionally, the price traded above both EMAs, reinforcing the positive outlook.
The MACD further supported this bullish stance, as both the MACD line and the signal line have moved into a bullish trajectory, forming a bullish cross. The accompanying histograms on the daily chart are also notably bullish.
The RSI adds to the optimistic sentiment, having advanced above the 50-level and the 14-day SMA. Currently, the RSI stands at 64, signaling strong bullish momentum in the price.
Summary
Solana’s price is advancing with strong bullish momentum, highlighted by a 30% surge from dynamic support, a golden cross in EMAs, and bullish signals from MACD and RSI.
Trading volume and derivatives activity have increased significantly, reflecting investor confidence. SOL has the potential to reach new highs, possibly $210.
Disclaimer
This article is for informational purposes only and does not provide any financial, investment, or other advice. The author or any people mentioned in this article are not responsible for any financial loss that may occur from investing in or trading. Please do your research before making any financial decisions.




