
 Bitcoin
 Ondo
Ondo NEAR Protocol
 Walrus
 Pearl
Pearl Pons
Pons Ethereum
- Akash Network token price sharply reverted gains from the supply region.
- A drawdown of over 20% was noted in the last two weeks.
The Akash Network (AKT) token price failed to extend the breakout rally beyond the barricades of the supply zone and faced rejection in the past sessions.
Afterward, the seller army continued to push the token, and follow-on selling pressure led the token to lose over 20% in the last two weeks.
The price action witnessed a sudden selloff, and the token struggled close to the 100-day EMA mark. The ongoing price action highlights that the token may extend the ongoing retracement toward the crucial support zone of the $3.80 mark ahead.
At press time, the Akash Network (AKT) price traded at $4.56 with an intraday spike of 2.01%, reflecting neutrality on the charts. It has a monthly return ratio of -8.40% and 596.20% yearly.
The pair of AKT/BTC is at 0.0000636 BTC, and the market cap is $184.01 Million. Analysts are neutral and suggest that the AKT price may face further selloff and might lose the gains ahead.
Can AKT Price Resist Selloff Near $4 Mark?
Amidst the volatility, the price action signifies that the token may find support near the round mark of $4 and will regain strength ahead.
However, a break and close below the $4 mark would trigger a sharp fall ahead.
Bulls need to secure the 200-day EMA mark for a smooth rebound in the next sessions.
Following the price decline, buyers are trying to acquire momentum and are eyeing a significant rebound from the 100-day EMA mark.
Source: TradingView
The intraday trading volume remained flat and surged by over 8.78% to $14.57 Million, while the total supply value is 125.87 million.
Notably, the AKT token ranked at 285 and has a fully diluted market cap of $1.76 Billion. If the token takes support on the 100-day EMA mark, buyers need to retain the $5 mark to undergo the rebound ahead.
The RSI curve drags below the midline region, and a negative crossover was noted on the charts. Likewise, the MACD indicator saw a bearish crossover, which implies a negative outlook ahead.
The AKT token price drags below the 61.8% Fib support zone and might soon retest the 50% zone near $3.80.
A tweet by @TraderSteve highlights that AKT has faced a lot of selling pressure near the $6 mark and is not in the buying range now. Any further decline toward the $3 range will be seen as a buying opportunity.
One of the most hyped cryptos currently $AKT @akashnet_
— TraderSteve_ (@TraderSteve_) June 6, 2024
Really don’t see reason to be bullish here just yet as I see a lot of selling in the $6 range
Nonetheless we already saw Akash 30x in the last year so it’s only normal
I’m a buyer again in the 3$ range if it comes pic.twitter.com/K5ggeuj3ng
Source: X
What do Social Factors Suggest?
This week, the social dominance value surged over 7% to 0.032%, revealing the nominal discussion activity of investors on social media platforms.
Source: Santiment
Furthermore, the X followers data witnessed a steady decline and dragged to 12, displaying a negative outlook.
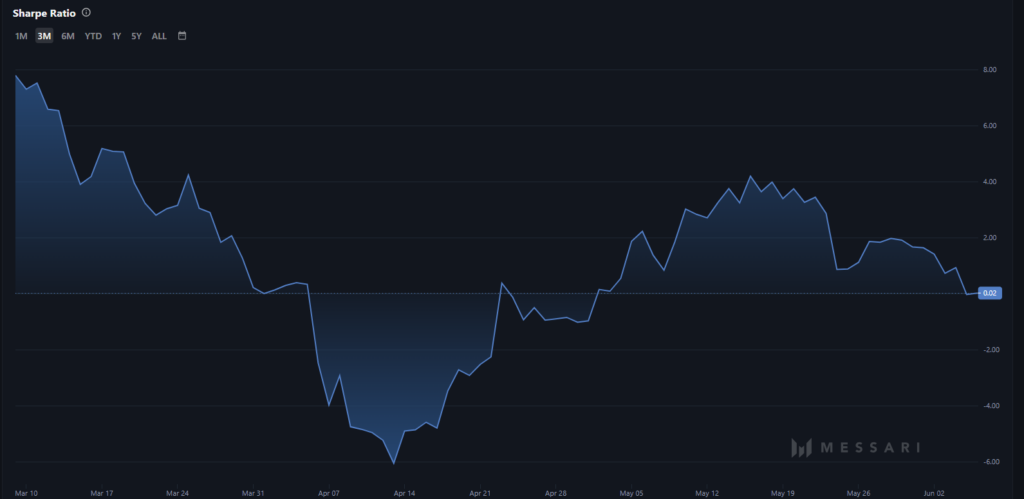
Sharpe Ratio Outlook
As the price retraced toward the 100-day EMA mark, the value of the Sharpe ratio also returned to the origin and dragged to the 0.02 mark.
The immediate support levels for the Akash Network (AKT) token are $4 and $3.80, whereas the key upside hurdle is around $4.80, followed by $5.40.
Conclusion
The Akash Network (AKT) price stayed close to the 100-day EMA mark and retraced only by 25%. Still, the token may display further volatile moves, retest the 200-day EMA mark, or reflect a rebound soon.
Disclaimer
The views and opinions stated by the author or any other person named in this article are for informational purposes only and do not constitute financial, investment, or other advice.




