
 Pearl
Pearl Zylo Ecosystem
 Bitway
 Walrus
 Starknet
 Quantus
 Pudgy Penguins
- SUI crypto has witnessed a sharp surge in its trading volume.
- The price action on the crypto charts reflects uncertainty in the trading price.
Sui is a layer-1 blockchain platform built by Mysten Labs to enhance scalability, security, and developer accessibility using the Move programming language.
It features zkLogin, sponsored transactions, and programmable transaction blocks. Founded by former Meta blockchain architects, Sui aims to improve Web3 user experiences with stable fees and high throughput.
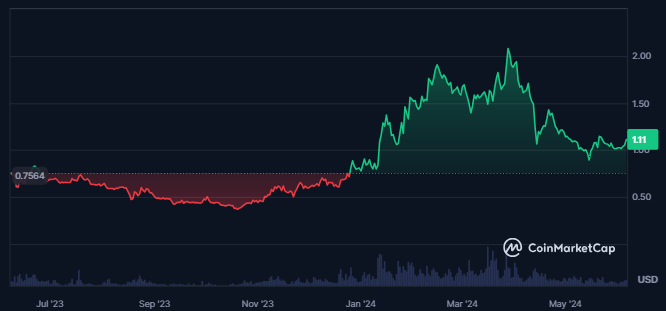
The CoinMarketCap shows that the price of the SUI crypto is trading above its last one-year base price. This shows that bulls have managed to rule in the last one year.
The trading volume of the SUI crypto has also surged, resulting in an advance of 42% over the last 24 hours from press time. With the advance in volume, the market cap of crypto has also advanced by 5%.
The following surge in the metrics shows buyers evolving in the crypto and strengthening the uptrend. Also, SUI is the 46th largest cryptocurrency in the global crypto market.
Do Derivatives Show Significant Activity in SUI Crypto?
The most recent scenario and the chart of the Coinglass show the beginning of a surge in the open interest and the volume of crypto derivatives.
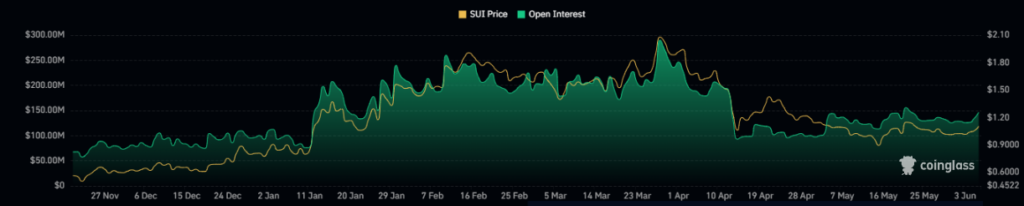
Looking at the most recent data at press time, a surge of 36% in the derivatives trading volume of the crypto can be seen. The open interest of crypto further has advanced by 10%.
The surge in the crypto’s open interest shows that crypto traders are gaining confidence and increasing their open positions in the crypto. As there is a surge in volume, advances in the trader’s engagement in the crypto can also be witnessed.
SUI Crypto Technical Analysis
The SUI crypto price has formed a small range followed by a strong downtrend, and the crypto price is currently revolving around the same.
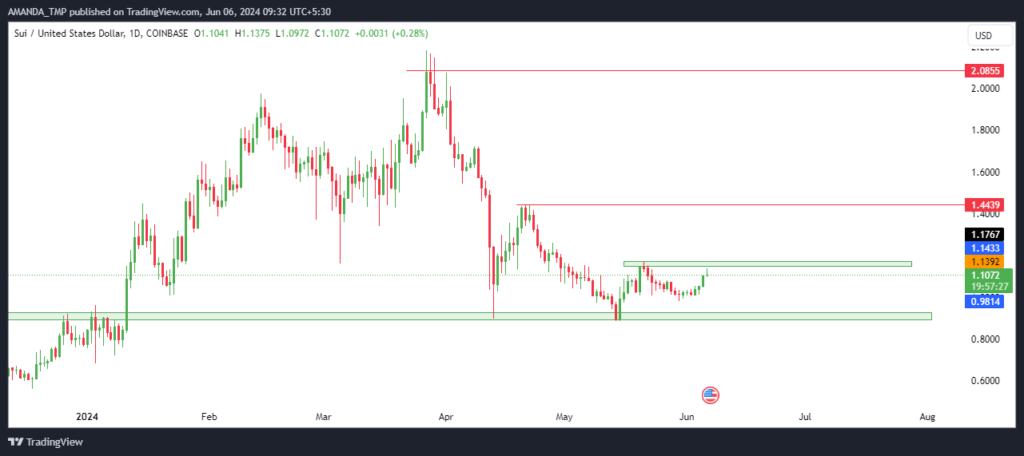
The trading price of the SUI crypto has been witnessing profit booking since the end of March 2024. The crypto price has consistently slipped from the swing of $2.1816 to the level of $1.1073, which was also the LTP at press time.
The decline in the crypto price is further followed by the formation of lower lows on the daily crypto chart.
The recent scenario on the chart shows that the crypto price has formed small swing highs, which can now be considered a change in character levels.
If the crypto price further pushes above the level of $1.18 and sustains above the same, a small surge in the crypto price might be seen. Therefore, one must wait for the SUI crypto price to break in either direction for the continuation of the price.
SUI/USD Chart by TradingView
The technicals on the daily chart of the SUI crypto further exhibit uncertainty in the trend as multiple technical indicators are opposing each other’s signals.
The MACD and the signal line are trading in a bullish cross, followed by the metrics trading in the negative territory.
The RSI further has broken above the 50-level, followed by a breakout above the 14-day SMA, which shows a rise in the momentum of the crypto price.
Summary
The SUI has seen a notable surge in trading volume and market cap, reflecting increased buyer activity.
Despite this, its price action remains uncertain, oscillating around recent lows. Technical indicators show mixed signals, with bullish momentum in RSI but conflicting trends in MACD, suggesting potential volatility ahead.
Following the existing downtrend, the support levels for the SUI are $0.680 and $0.880. Resistance levels for the crypto are $1.40 and $2.00.
Disclaimer
This article is for informational purposes only and does not provide any financial, investment, or other advice. The author or any people mentioned in this article are not responsible for any financial loss that may occur from investing in or trading. Please do your research before making any financial decisions.




