
 Pearl
Pearl Bitway
 Sui
Sui Pons
Pons Starknet
 Quantus
 Bitcoin
- The top 10 holders of the Quant crypto hold 28.86% of the supply.
- 97% of the top 100 crypto assets have outperformed Quant token price in the last 1 year.
Quant, launched in June 2018, developed the Overledger Network. It is a blockchain operating system enabling interoperability across multiple blockchains.
Using QNT tokens, it supports decentralized applications (dApps) and employs a hybrid PoS and PoA consensus mechanism. Co-founders Gilbert Verdian and Dr. Paolo Tasca led the project.
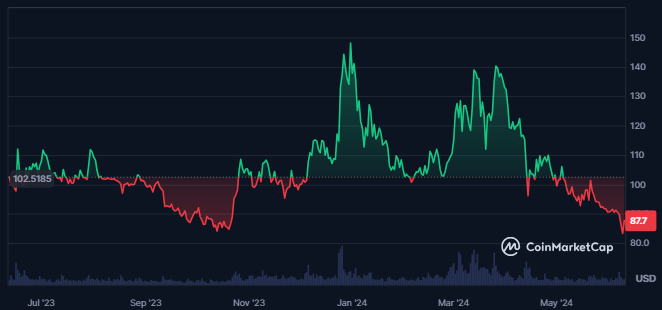
The market cap of Quant crypto has advanced by 5% in the last 24 hours, which stands at $1.060B. Quant is the 80th largest cryptocurrency in the global crypto market, with a market cap dominance of 0.04%.
Despite the advance in the market cap, the value of the traded volume for the crypto has declined by 18%, which shows the loss of confidence among traders and investors. It also shows that the price rise might not be sustained based on current data points.
What Does Derivatives Indicate About Qunat Crypto?
Following the decline in the spot volume, the derivatives volume has also declined by 21.1%. This further results in a traded value of $9.67M while the open interest has advanced by 2.53%.
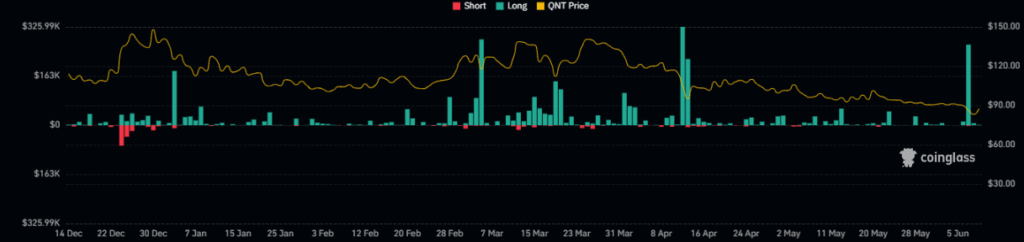
The Quant crypto liquidation chart shows massive long liquidations over the last few days, showing solid profit booking in the crypto. It also indicates bears currently dominate the crypto price.
Even over the last 24 hours from the press time, the crypto has witnessed a long liquidation of $1.42K, while the short liquidation for the crypto is nil.
Hence, the advance in the open interest indicates the rise in the open positions in crypto, whereas higher long liquidation indicates a bearish outlook in cryptocurrency.
QNT Crypto Technical Analysis
The QNT crypto price has hit crucial support levels after the existing breakdown.
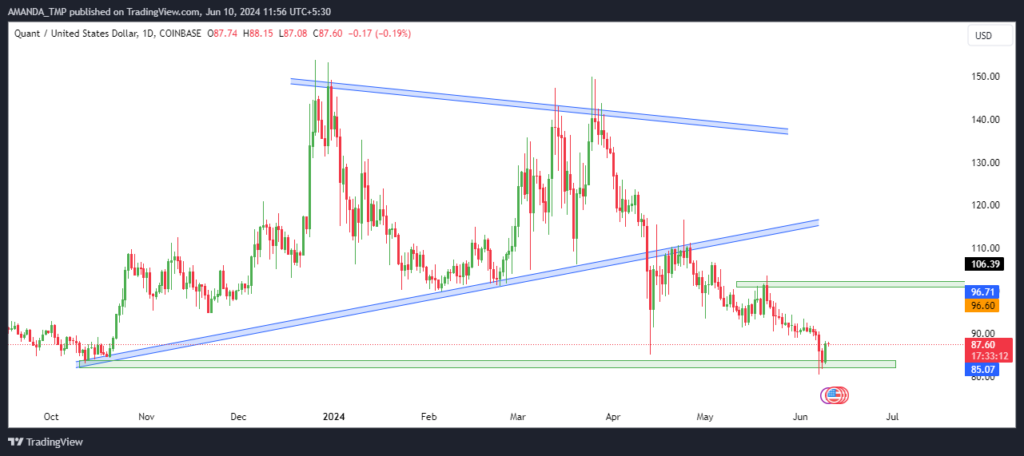
The price of the QNT crypto can be seen following a strong downtrend on the daily chart, followed by the formation of lower low swing structure.
Moreover, if we look at the overall price action, the QNT crypto trading price has broken below a symmetric triangle pattern, and since then, it has witnessed profit booking.
Since the breakdown in the price, the QNT crypto declined by 25% and is currently forming a bullish candlestick, showing signs of a pause in the decline in the price.
Moreover, while declining, the crypto price formed swing highs, which might act as resistance if the price reverses for an uptrend.
A crucial level of $104.00 is situated at the higher levels, and if the price breaks above the given level and sustains above the same, we might get to see higher levels in the future.
QNT/USD Chart by TradingView
The 50-day and the 200-day EMAs on the daily chart of the QNT crypto are trading in a death cross, indicating a strong downtrend in price. The crypto price is also trading below the EMAs for a long time.
The MACD and the signal line are trading below the median level and have overlapped each other, showing volatility and weakness in the crypto.
The RSI has sustained below the 50 level and is following a bearish cycle, indicating a declining momentum in the crypto price.
Summary
Quant, launched in June 2018, developed the Overledger Network for multi-blockchain interoperability.
Despite recent market cap growth, QNT faces bearish trends, with significant long liquidations and declining spot and derivatives volumes. Technical indicators show a downtrend, and key resistance at $104 needs to be breached for potential recovery.
Moreover, the key support levels for the QNT crypto are $75.0 and $80.0, followed by the resistance levels of $116.0 and $145.0.
Disclaimer
This article is for informational purposes only and does not provide any financial, investment, or other advice. The author or any people mentioned in this article are not responsible for any financial loss that may occur from investing in or trading. Please do your research before making any financial decisions.




