
 Pearl
Pearl Zylo Ecosystem
 Bitway
 Derive
 Walrus
 Quantus
 Pudgy Penguins
- Render’s project has a strong market and financial health highlighting its strong presence.
- The majority of the holders of RNDR are in profit and have held the token for more than the last 1 year.
A surge of 50% in the trading volume of the Render token was recorded in the last 24 hours.
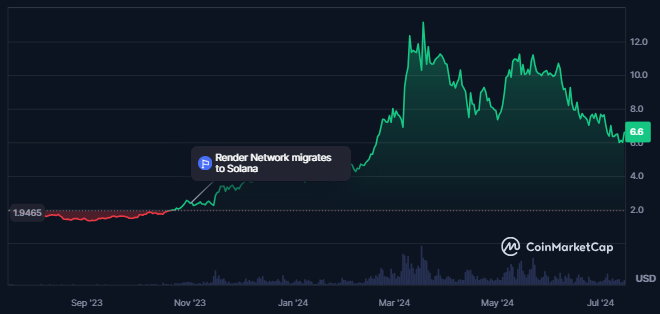
The market cap of RNDR is $2.571 Billion which makes it the 34th largest token in the global crypto market. It further has a strong market presence resulting in a market cap dominance of 0.10%.
The price volatility of the token is high (8.63%), while the fear and greed index of RNDR is neutral as per Coincodex. Sentiment is bearish and the supply inflation of the token is also low (0.21%).
The token has medium liquidity as 5.61% of the market cap of the token was traded in the last 24 hours. Also, the value of the traded volume of the token is $148.54 Million.
24.2K addresses hold RNDR and the top 10 holders of the token have 0.17% of the supply. Out of the total holders of the token, 78% of them are large holders.
The fully diluted market cap of the token has declined by 22% in the last 30 days to $3.28 Billion. As per IntoTheBlock, 51% of the holders of the token are in profit while 40% of them are making a loss.
Render Token Derivatives
The value of the derivatives traded volume for the token has advanced by 52% in the last 24 hours at press time.
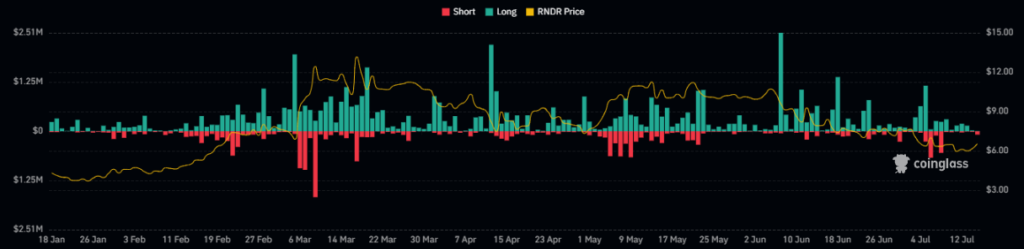
RNDR displayed higher short liquidations over the last few days. This shows that the bulls are taking over. The open interest of the Render token rose by 7% to $88.68 Million which shows a rise in open positions in the token.
Also, the recorded short liquidation for the token is worth $94.28K which is much higher than the long liquidations of $14.88K. This also has resulted in a long/short ratio of 0.9673.
Technical Analysis
RNDR had been confined within a descending triangle pattern for a significant period. This technical formation, typically seen as a bearish indicator, persisted until July 4th, 2024, when the token price broke below the pattern’s support level. This breakdown has subsequently invited increased selling activity, reflecting a shift in market sentiment.
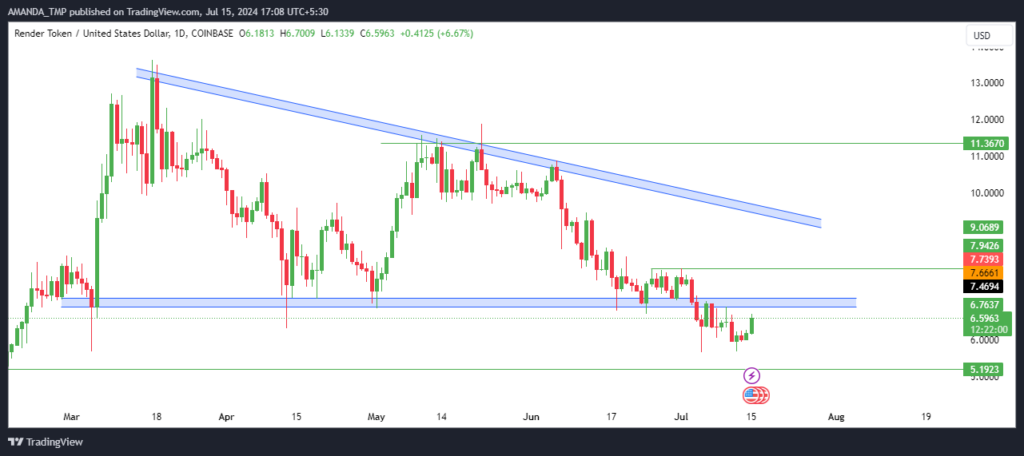
The recent price behavior suggests the potential for further declines. The breach of the descending triangle pattern is a strong signal of continued downward momentum. Market participants often interpret such breakdowns as a cue for additional selling pressure, which could lead to a sustained decrease in RNDR price.
RNDR/USD Chart by TradingView
The 50-day and the 200-day EMAs are trading in a golden cross on the daily chart while RNDR declined below the following EMAs. If the token manages to rebound above the EMAs, a surge in the price is likely.
The MACD and the signal line overlapped while both factors are below the zero level in the negative trajectory. This shows uncertainty in the price of the token.
The RSI has broken above the 14-day SMA while it sustains below the 50-level. This shows uncertain momentum in the price. RNDR has broken below a descending triangle pattern, signaling potential further declines.
Despite strong market and financial health, increased trading volume and market cap suggest bearish sentiment. Technical indicators show uncertainty, with mixed signals from MACD, RSI, and EMAs, indicating an unclear price direction.
The support level for the RNDR token is $3.30 and $5.10 which is further followed by resistance levels of $7.60 and $11.30.
Disclaimer
This article is for informational purposes only and does not provide any financial, investment, or other advice. The author or any people mentioned in this article are not responsible for any financial loss that may occur from investing in or trading. Please do your research before making any financial decisions.




