
 Wisp
Wisp Identity.md 6900
 Bunker Mode
 Crawlerpad
 Claudia
 Pearl
Pearl NEAR Protocol
- The BONK coin price has been highly volatile, resulting in 12.25%.
- The coin’s fear and greed index was 71, showing greed among the investors.
The Bonk coin price sentiment has been bullish, as per the analysts. It also has a strong market presence, with a market cap dominance of 0.08%.
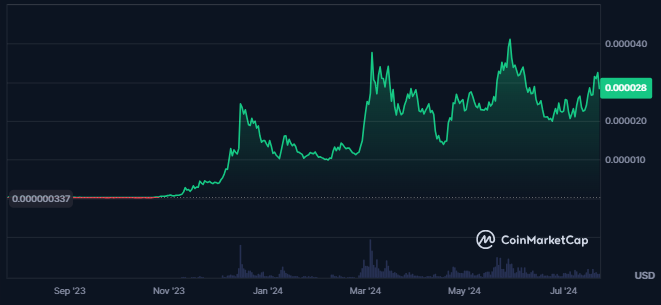
Price Overview Chart of BONK | Source: CoinMarketCap
When writing, the Bonk coin had 19.1K holders, and the top ten holders held 68.45% of BONK’s total supply. Also, the number of coin holders has increased over the last few days.
The coin’s supply inflation was very high, resulting in 44.55%, followed by a total supply of 92.911T BONK. Also, the coin’s circulating supply was 68.917T BONK, resulting in a fully diluted market cap of $2.636B.
The Bonk coin’s volume/market cap ratio was 14.86%, followed by the coin’s traded volume value of $289.959M. Also, the coin’s market cap ranking was #50, as per CoinMarketCap.
The Bonk coin’s market cap value has been $1.956B, and the Bonk coin’s price has advanced by 30700%.
BONK Coin Derivatives Data Analysis
When writing, the value of the coin’s derivatives traded volume has declined by 26% in the last 24 hours. This further has resulted in a traded value of $72.21M.
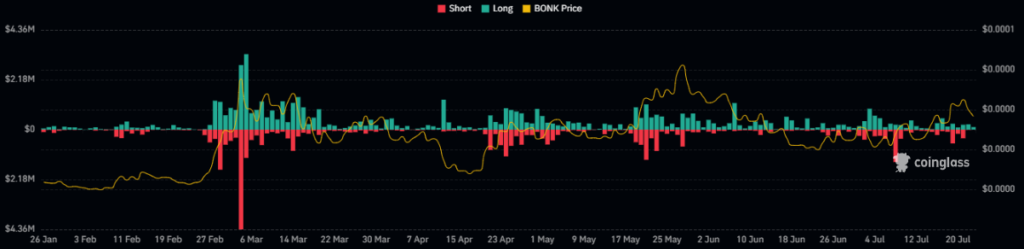
BONK Coin Derivatives Liquidation Chart | Source: Coinglass
The Bonk coin’s open interest has declined by 7.7%, resulting in $9.12M. It has resulted in a higher long liquidation of $223.34K, followed by a short liquidation of $13.92K.
Despite the higher long liquidations in the coin’s price in the last 24 hours, the coin’s liquidation chart showed higher short liquidation over the last few days. This showed buyers’ dominance in the overall cost of the coin.
BONK Coin Technical Analysis
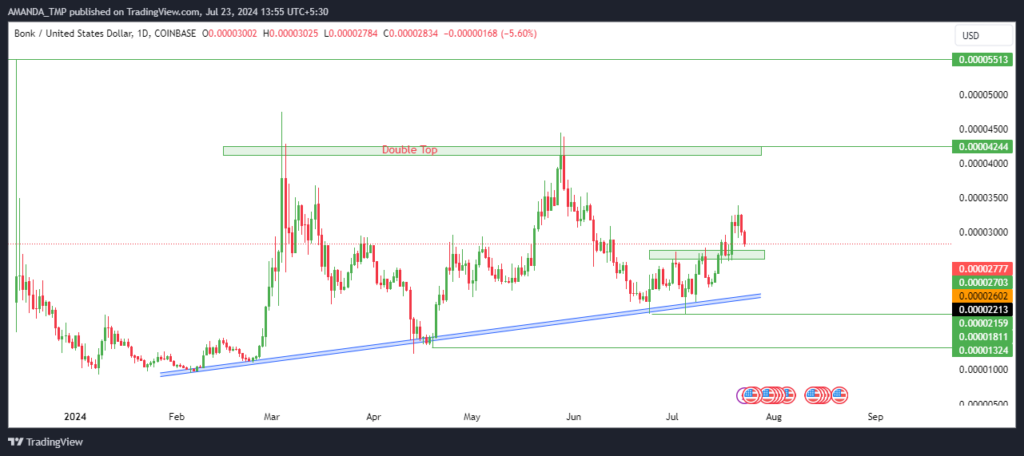
The Bonk Coin price demonstrated remarkable resilience, maintaining its position above a dynamic trendline for over five months.
BONK Coin Daily Price Chart | Source: TradingView
The price chart revealed a higher-level double-top formation, which initially led to a decline. This bearish pattern signaled a temporary weakness as the price dropped.
However, the coin price quickly found support once again at the dynamic trendline, reinforcing its role as a key support level.
After this dip, the Bonk Coin broke above a crucial resistance level. This breakout was a significant bullish signal, indicating renewed investor interest and buying activity.
BONK/USD Chart by TradingView
A golden crossover was formed on the Bonk Coin’s daily chart with the 20-day and 50-day exponential moving averages (EMAs). This bullish indicator signaled potential continued upward momentum.
Furthermore, the Moving Average Convergence Divergence (MACD) indicator and its signal line have crossed above the zero level on the chart. This movement signified a bullish trend in BONK Coin’s trading price, highlighting growing positive momentum.
The Relative Strength Index (RSI) also gave a closing above the 50-level and was trading at 61. This RSI line breakout above the 14-day Simple Moving Average further supported the bullish outlook, indicating strong buying pressure.
The Bonk Coin price Increased by 30700%
The Bonk Coin price has surged by 30700%, maintaining strong bullish momentum with key technical indicators showing positive trends.
Despite higher long liquidations, short liquidations dominate, indicating buyer strength. With 19.1K holders and rising, BONK’s market cap has been $1.956B, ranking #50 on CoinMarketCap and displaying a robust market presence.
The BONK coin’s support levels have been $0.00001320 and $0.0000180, followed by the resistances of $0.0000420 and $0.0000550.
Disclaimer
This article is for informational purposes only and does not provide any financial, investment, or other advice. The author or any people mentioned in this article are not responsible for any financial loss that may occur from investing in or trading. Please do your research before making any financial decisions.




