
 Pearl
Pearl Bitway
 Monad
Monad Ondo
Ondo Derive
 Walrus
 Zcash
Zcash
- AR token price has outperformed 86% of the top 100 crypto assets in the last 1 year.
- In the last 30 days, the Arweave token price traded in green for 17 days.
At press time, 99.47% of the token’s maximum supply circulated in the market, resulting in 65.652M AR. Also, the maximum supply of the token was 66.0M AR, and the fully diluted market cap was $1.597B.
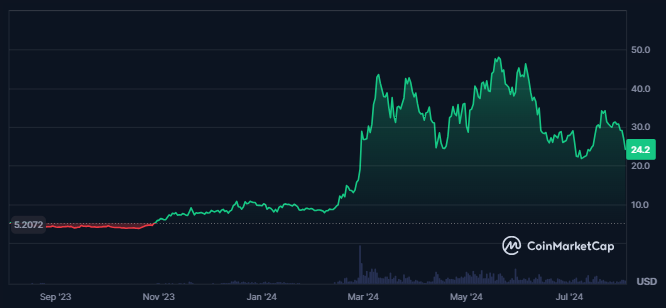
Price Overview Chart of AR | Source: CoinMarketCap
In the last 1 year, the token’s price advanced by 350%. However, it consolidated in a dynamic range, followed by strong volatility, resulting in 14.34%. Also, the token’s market cap dominance was 0.07%, followed by a value of $1.583B.
The Arweave token’s market cap also declined by 5.9%, following which the traded volume declined by 20%. This further resulted in a traded value of $68.66M. It showed a decline in the demand for the token among the investors.
Arweave token’s security score was 72.95, and the global security ranking of the token was 1586, as per Certik Skynet. It also belonged to the BBB tier, but the governance strength of the token was weak.
An all-time high price of $90.94 was achieved three years ago in the token. Since then, the AR token price has declined by 73%, and the ATL price of the token has been $0.4854. The token’s price also advanced by 4800% from its all-time low price.
Arweave Token Derivatives Data Analysis
The derivatives traded volume of the Arweave token witnessed a decline of 12.4% in the last 24 hours. This resulted in a traded value of $119.83M, which showed a decline in the traders’ interest in the token.
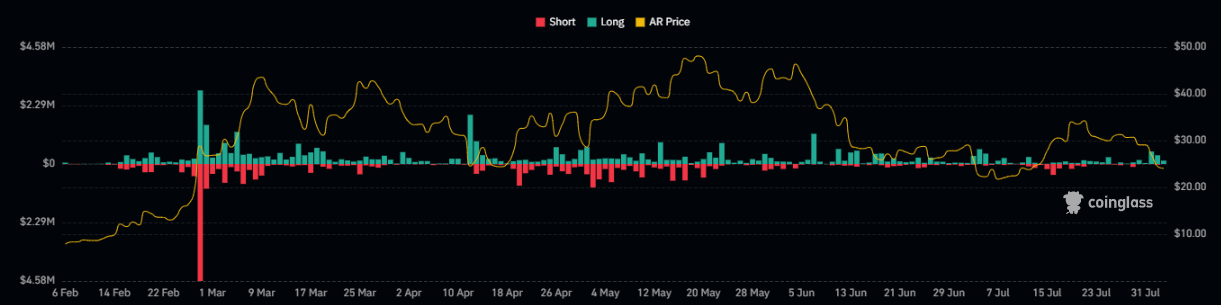
Arweave Token Derivatives Liquidation Chart | Source: Coinglass
The open interest in the token also declined by 5.4%, which resulted in $57.87M. The following also resulted in a long/short ratio of 0.895, which showed higher long liquidation.
Additionally, the long liquidations in the token were worth $374.45K recorded in the last 24 hours from the press time. Despite this, the shorts worth $24.3K were liquidated, which showed bear dominance in the price.
AR Token Technical Analysis
The AR token has recently experienced a significant price surge, reflecting strong upward momentum in its value. However, in the last few days, the token has begun to witness a decline, raising concerns among investors.
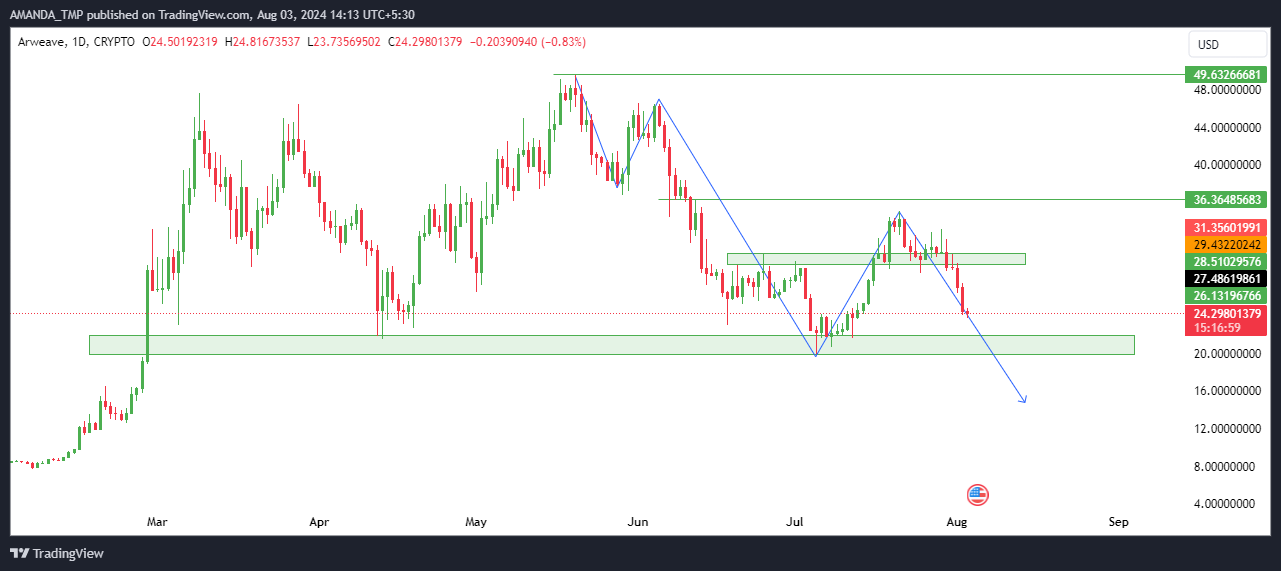
AR Crypto Daily Price Chart | Source: TradingView
Previously, the AR token faced a substantial decline. It dropped from a swing high of $49.5 and lost 60% of its value over a 45-day period. This extended downward trend eventually led the price to a strong support zone, providing some stability after the steep fall.
The current decline followed the recent surge. It suggested that the market is undergoing a period of correction and consolidation in the price.
What Do Technical Indicators Of Arweave Indicate?
The AR token price has declined below the 200-day EMA. However, the 50-day and 200-day EMAs have traded in a golden cross. This exhibited uncertainty in the token price, followed by a reversal in the price trend.
AR/USD Chart by TradingView.com
The MACD and the signal line have traded in a death cross while both the metrics sustained above the bullish trajectory. This showed neutrality in the token’s price, followed by the bearish histograms on the chart.
The RSI had also declined below the 50-level and the 14-day SMA. At press time, the RSI traded at a level of 34.8.
If the AR token price continues to decline, it might take support at the level of $12.50 and $19.80. This would be followed by the resistance of $35.0 and $50.0.
Disclaimer
This article is for informational purposes only and does not provide any financial, investment, or other advice. The author or any people mentioned in this article are not responsible for any financial loss that may occur from investing in or trading. Please do your research before making any financial decisions.




