
 Pearl
Pearl Bitway
 Walrus
 Optimism
 Pons
Pons Quantus
 NEAR Protocol
- The APT price has surpassed the 20-day EMA and surged by 55% in a week.
- Aptos token’s price has extended to the crucial level of breakout.
The APT price has displayed a slow and steady fall after the sharp selling at the beginning of April. After mid-April, the Aptos price fell by forming lower lows and lower highs.
From another perspective, the digital asset price has been falling through a descending channel. After taking support on the lower trendline, the price has extended to the upper trendline.
Exceeding the 20-day EMA would be a bullish sign, but the price was still below the 200-day EMA at the press time. Based on the chart structure, the major support level of $8 has flipped to the resistance level. It showed the sellers’ dominance.
Analyzing the RSI
The Relative Strength Index (RSI) has rapidly recovered from the oversold zone and is heading toward the overbought zone.
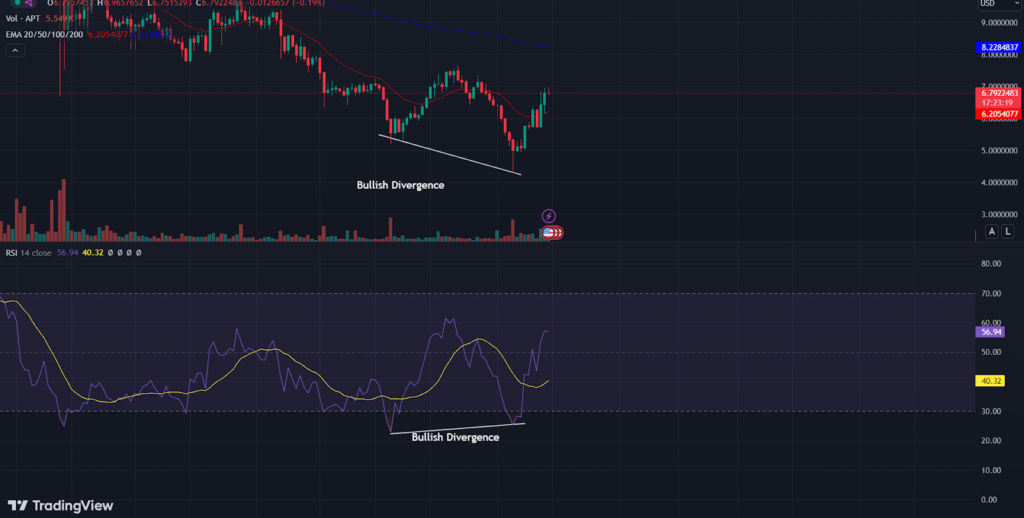
It has triggered a golden crossover with the RSI-based moving average. The RSI has displayed a bullish divergence, which could be a bullish sign.
Would the APT Price Shoot Up After the Breakout?
A source on X claimed that the Aptos crypto price had reached the breakout zone. The price has been declining through a falling wedge pattern. After the consolidation for a long time, the price has shaped a ‘Falling Wedge’ pattern.
$Apt#Apt Breaking Out As Expected https://t.co/pO4MmPhdra pic.twitter.com/nHz6KpGQjA
— World Of Charts (@WorldOfCharts1) August 12, 2024
Suppose the crypto asset price triggers a breakout from the falling wedge pattern. It is expected to gain 2x return in the next few days.
APT Price Technical Analysis Over 1-D Timeframe
According to the technical chart, the APT price has surged to the crucial zone of $7. After mid-June, the price triggered a breakdown after the consolidation of 2 weeks. The buyers had tried to exceed this hurdle in July but couldn’t. At press time, the crypto asset price has reached this zone.
Suppose the price faces resistance from the $7 mark; sellers may show interest and drag the price down to the recent low. On the other hand, if the buyers overcome this zone, buying momentum for the long term can be anticipated.
On the flip side, the bearish trend in Aptos price was halted near the $5.50 hurdle and showed bullishness.
However, sellers managed to drag down the price below this level, but the RSI showed a bullish divergence. After the bullish divergence, buyers dominated, and the price surged by more than 50% in a week.
Aptos Price Overview
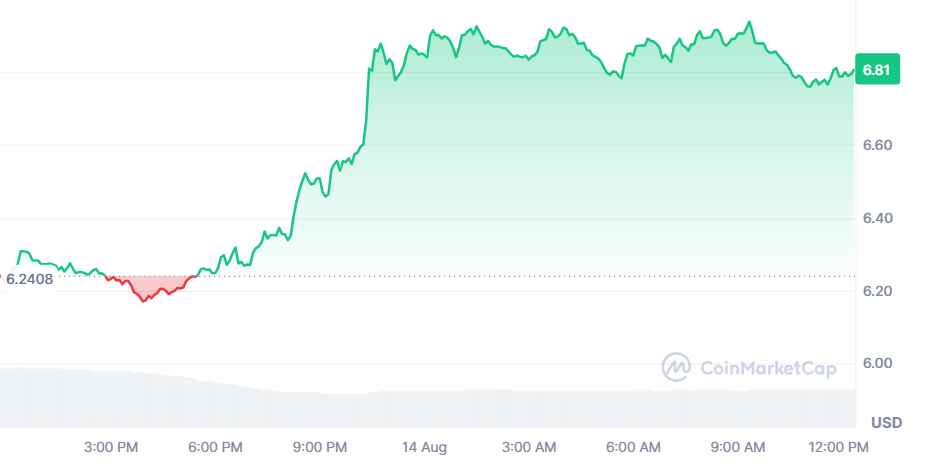
Aptos crypto was being traded at $6.80 at the time of writing and has remained neutral in the past 24 hours. It has a market capitalization of $3.29 Billion, and its 24-hour trading volume is $147.17 Million.
Would the Aptos Price Decline or Keep Surging?
The APT price has shown weakness in a broader time frame after showing price rejection from the $18 hurdle. It has been falling because of resistance from a declining trendline.
RSI has generated a bullish crossover, and the bullish divergence showed the bullish forecast. The price has surpassed the 20-day exponential moving average and is eyeing for the 200-day EMA.
Technical Levels
The bullish trend in the Aptos crypto can be interrupted near the $7.00 and $10.00 levels. The price may take support at the $5.50 and $4.80 mark.
Disclaimer
This article is for informational purposes only and provides no financial, investment, or other advice. The author or any people mentioned in this article are not responsible for any financial loss that may occur from investing in or trading. Please do your research before making any financial decisions.




