
 Wisp
Wisp Doge Pepe
 Zylo Ecosystem
 Crawlerpad
 Pudgy Penguins
 Pearl
Pearl Basic Attention
- The Total Value Locked For Beam token has recently declined to $2.82M.
- Most technical indicators gave a sell signal for the BEAM token price.
At press time, the BEAM token traded 200% above its all-time low price of $0.004241, achieved 10 months ago. Additionally, the token price had advanced by 174% in the last 1 year.
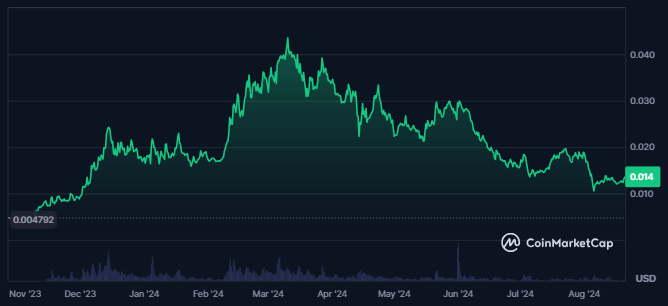
The market cap dominance of BEAM tokens was 0.03% at the time of writing. A market cap of $673.66M followed this—moreover, 79% of the token’s maximum supply circulated in the market.
The token’s circulating supply was 49.466B BEAM, followed by a total supply of 62.434B BEAM. Also, the token’s fully diluted market cap was worth $848.050M.
A surge of 64% in the value of derivatives traded volume was recorded. This resulted in a value of $12.174M, showing a token demand rise.
Also, the token’s liquidity was certainly low, resulting in 1.79%. At the same time, its market cap advanced by 10.1% in the last 24 hours. The fear and greed index was at 30, showing greed among investors.
While the spot volume of the token witnessed and advanced, the derivatives volume faced a decline of 0.54%. This showed a lack of interest in token derivatives among investors and traders.
The token’s open interest further advanced by 18%, resulting in a value of $4.42M. Despite this, a strong decline in the token’s liquidation activity was also recorded.
Financial Data Overview Of BEAM Token
At press time, 12% of the token’s total holders were in profit. Meanwhile, the other 85% witnessed a loss and were sitting out of money. The large holder’s concentration in the BEAM token was 86%.
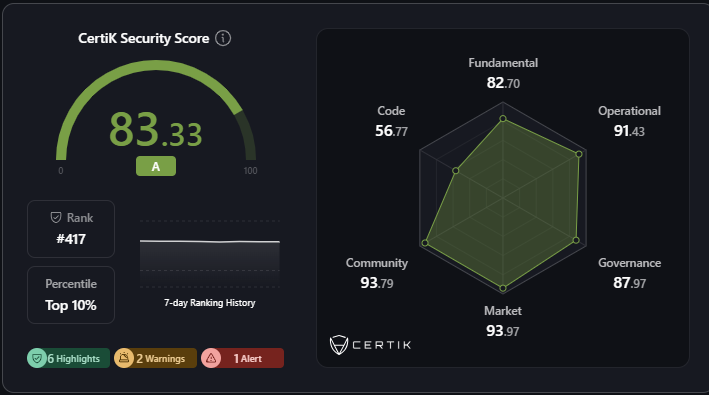
The security score of the BEAM token was 83.33 at press time and belonged to the A tier. Also, its world’s security ranking was #417 as per Certik Skynet and had a strong fundamental score of 93.97.
The token’s operational score was also strong, while the code score was the lowest, resulting in 56.77. Additionally, it earned only 31 stars on GitHub and 46 followers.
BEAM Token Technical Analysis
The BEAM cryptocurrency has been in a prominent downtrend, consistently forming lower lows on the daily chart. It highlighted strong bearish pressure.
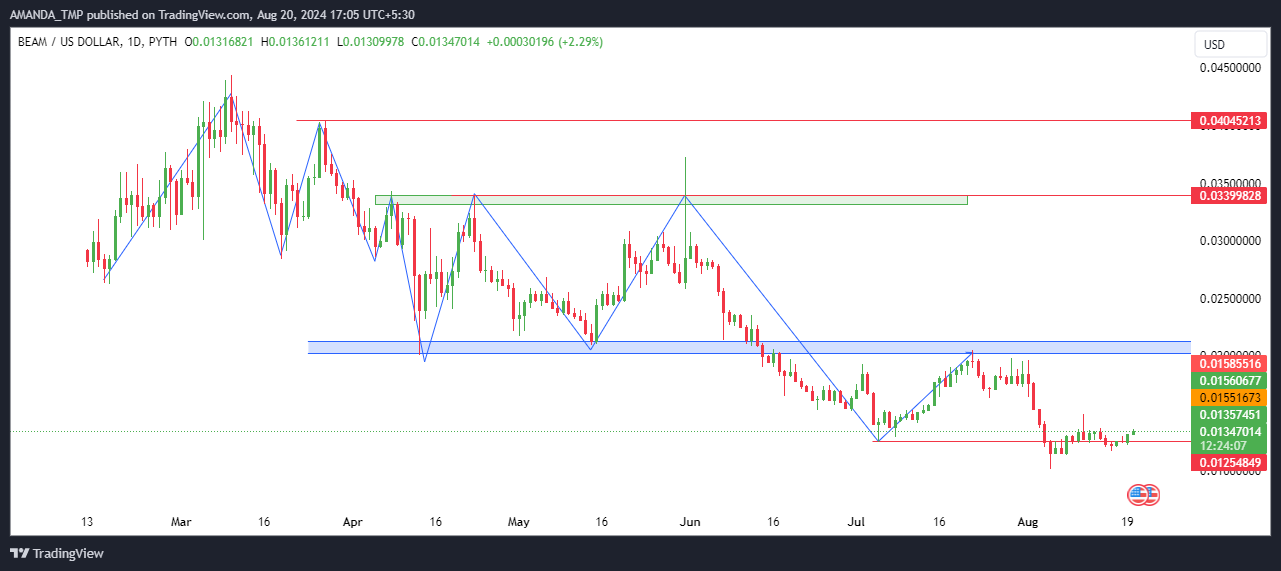
Any potential rebound is likely to face significant resistance, potentially triggering a liquidity grab that could drive prices back to previous lows. Recent breaches of critical support levels further reinforced the likelihood of continued downward momentum.
This was accompanied by technical indicators pointing to sustained bearish activity in the near term.
BEAM Token Technical Analysis
The technical indicators for BEAM cryptocurrency suggest uncertainty in its price trend. A key signal of potential bearish momentum is the death crossover between the 20-day and 50-day EMAs observed at press time. This crossover typically indicates a shift towards a downward trend.
BEAM/USD Chart by TradingView.com
Additionally, the Moving Average Convergence Divergence (MACD) and the signal line have been trading neutrally, overlapping each other. It reflected a lack of clear direction in the market. This neutral positioning underscores the current indecision among traders.
The Relative Strength Index (RSI) further reinforced the bearish outlook. Initially, the RSI found support at the 50 level, but it has since declined below the 14-day Simple Moving Average (SMA). It signaled a weakening of bullish momentum and a potential continuation of the bearish cycle.
The BEAM token price might take support at the level of $0.050 and 0.010, followed by the resistance levels of $0.20 and $0.0330.
Disclaimer
This article is for informational purposes only and does not provide any financial, investment, or other advice. The author or any people mentioned in this article are not responsible for any financial loss that may occur from investing in or trading. Please do your research before making any financial decisions.




