
 Wisp
Wisp Identity.md 6900
 Bunker Mode
 Crawlerpad
 Claudia
 Pearl
Pearl NEAR Protocol
- The ALGO token price has advanced by 37% in the last 1 year.
- The Algorand price was down by 97% from its all-time high price.
The market cap of the Algorand token witnessed a slight increase of 1.8% in the last 24 hours from press time. This further resulted in a market cap value of $1.079B and a market cap ranking of #60 in the global crypto market.
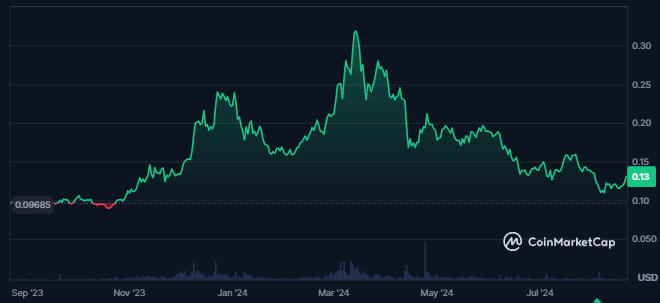
The token’s liquidity was certainly lower as the traded volume value declined by 6.7% in the last 24 hours. Also, the token’s traded volume value was $30.178M, which was just 3.05% of its market cap.
Additionally, the token’s maximum supply was 10.0B ALGO, which was similar to its total supply. Also, the circulating supply was 82.27% of the maximum supply, resulting in 8.227B ALGO. This was followed by a fully diluted market cap of $1.310B.
The large holders’ concentration on the token was 68%, and only 5% of its holders were in profit. Algorand had 38.06M holders at the time of writing, and its top 10 holders held 21.94% of the maximum supply.
Algorand Derivatives Data Analysis
The derivatives volume of the Algorand token witnessed a surge of 19.7% in the last 24 hours from the press time. This further resulted in a traded value of $40.48M, which was higher than the spot volume.
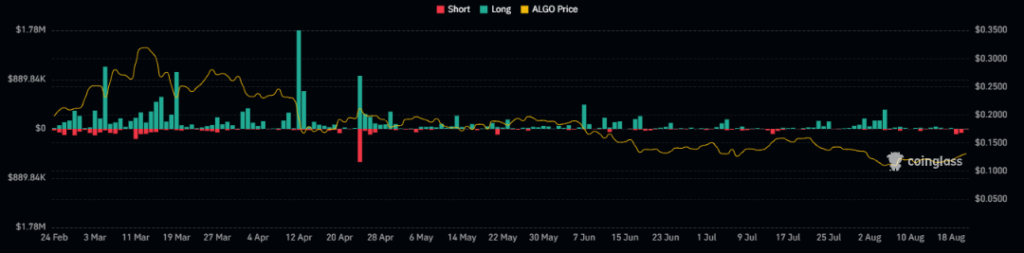
The liquidation chart of the Algorand token showed a decline in the liquidation activity in recent times. Additionally, shorts worth $71.37K were liquidated in the last 24 hours.
In contrast, the longs of only $3.72K were liquidated. This showed the dominance of bulls in the token price.
The open interest in the token further declined by 6.4% and resulted in a value of $24.77M, followed by a long/short ratio of 1.0899.
ALGO Token Technical Analysis
At press time, the ALGO token has been in a sustained downtrend, falling to new lows and approaching a critical dynamic support level. This persistent decline underscored the dominance of bearish sentiment in the market as sellers continued to exert pressure on the token’s price.
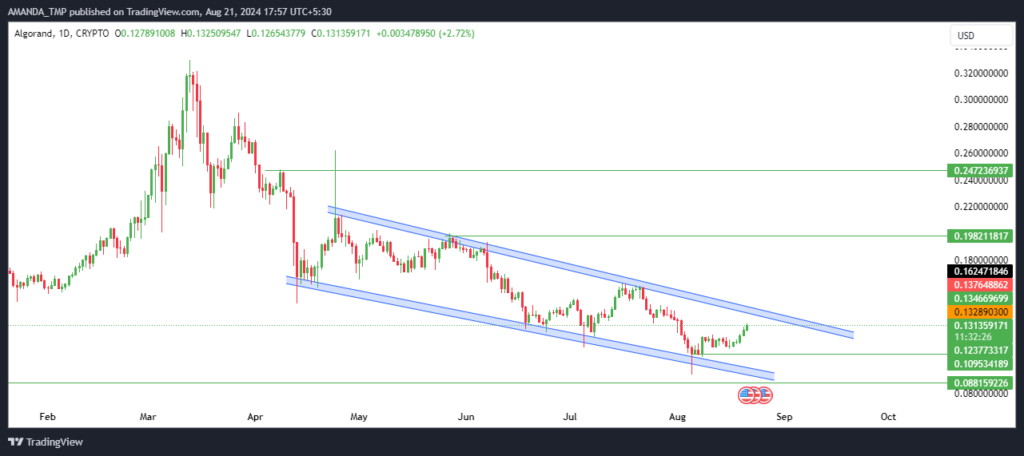
The consistent downward movement of ALGO has led to the formation of a falling wedge pattern. This technical indicator often signals a potential reversal. Recently, the token’s price touched this wedge’s lower boundary, suggesting it may be approaching a turning point.
Suppose the ALGO token rises and successfully breaks above the falling wedge pattern. If this happens, It could signal a shift in momentum, potentially leading to higher price levels soon.
Traders and investors will be closely watching for a breakout, which may indicate the beginning of a new upward trend.
ALGO Token Technical Indicator Overview
Following a prolonged price decline, the ALGO token experienced a death cross, where the 20-day and 50-day EMAs crossed. It reinforced the bearish outlook.
The token’s price has consistently traded below these EMAs, indicating sustained downward momentum.
ALGO/USD Chart by TradingView
Despite this, the Moving Average Convergence Divergence (MACD) and its signal line recently formed a golden cross. However, both metrics remain in a negative trajectory, reflecting a neutral stance from this indicator and contributing to uncertainty in the overall trend.
Adding to this mixed picture, the Relative Strength Index (RSI) recently advanced after dipping into the oversold zone. The RSI has now risen above the 14-day Simple Moving Average (SMA) and reached the 50-level on the chart.
This shift suggested potential volatility in the token’s price as traders assess these conflicting signals from various technical indicators.
The ALGO token price might witness support at the levels of $0.080 and $.10, followed by the resistances of $0.1980 and $0.240.
Disclaimer
This article is for informational purposes only and does not provide any financial, investment, or other advice. The author or any people mentioned in this article are not responsible for any financial loss that may occur from investing in or trading. Please do your research before making any financial decisions.




