
 Pearl
Pearl Bitway
 Monad
Monad Ondo
Ondo Derive
 Walrus
 Zcash
Zcash
- Conflux crypto had a very strong social dominance at the time of writing.
- The CFX price was down by 91% from its all-time high price of $1.70 three years ago.
The Conflux (CFX) token price traded at the level of $0.13 at the time of writing. It has advanced by 4.2% over the last 24 hours which could lead to a difference in the token’s price prediction.
The Conflux price was highly volatile, resulting in a volatility of 8.75%. Also, the supply inflation was high, resulting in 27.47%. This showed a higher probability of uncertain spikes in price, which a depreciating factor would follow in the token price.
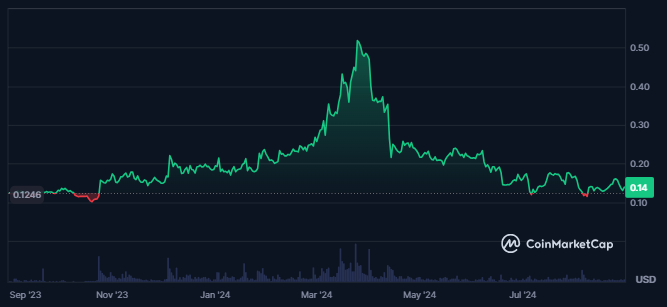
The Conflux crypto market cap was worth $603.591M, leading to the market cap ranking of #93 per CoinMarketCap. This was followed by a market cap dominance of 0.03% in the global crypto market.
A slow rise in Conflux holders can be seen over time. At press time, it had a total of 22.1K holders. The token’s top 10 holders held 71.85% of the total supply at press time.
The token’s largest holder also held 42.57% of the total supply, showing a strong concentration of large holders.
What Does Derivatives Have For Conflux Token?
The token’s derivatives volume and open interest increased over the last 24 hours from the press time. The derivatives volume advanced by 28%, resulting in a traded value of $78.17M.
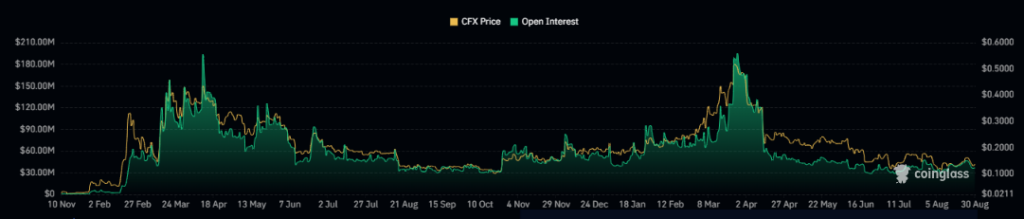
The CFX crypto’s open interest slightly advanced by 2.7% in the last 24 hours from the press time. This showed a slight surge in the token’s derivatives’ open positions.
The long/short ratio of the token further was 0.8262. Also, the higher longs worth $87.49K were liquidated in the token over the last 24 hours from the press time.
This was followed by a short liquidation of $59.96K, which showed the dominance of sellers in the token price.
Let’s Take A Look At The CFX Token Technical Chart
The CFX price has been trading in a downtrend, with consistent lower lows appearing on the daily chart in recent months.
However, momentum has shifted as the token has formed a bullish price action. The emergence of strong, bullish candlesticks marked it.
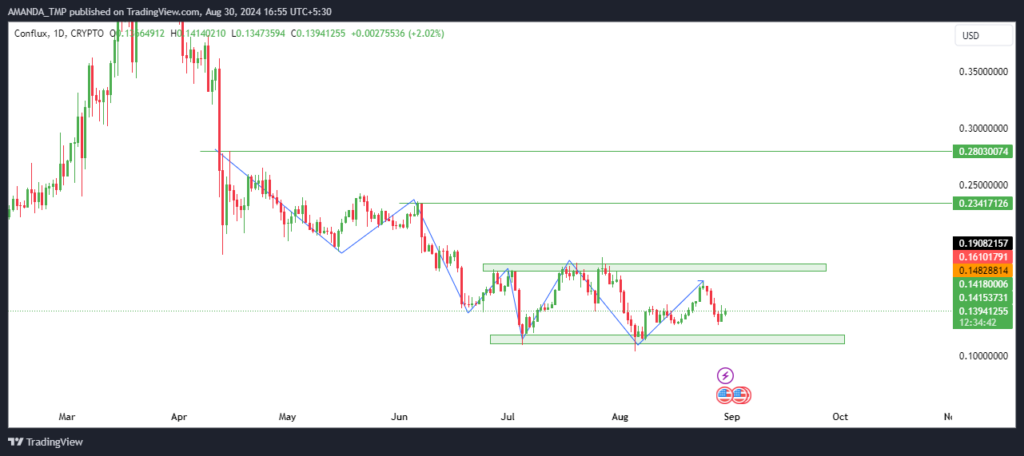
Despite the formation of bullish candlesticks in recent times, the token failed to stain the higher levels and declined back to the lower levels. The token price further traded inside a range for the last two months.
Thus, one must wait for the CFX crypto price to break above the consolidation zone and sustain above the same. The following behavior might increase the price and continue to an uptrend.
Do CFX Token Technical Indicators Also Exhibit Volatility?
The 20, 50, and 200-day EMAs traded in a death cross for a long time, following which the price traded below the given EMAs. This exhibited a strong downtrend in the token price.
CFX/USD Chart by TradingView.com
The MACD and the signal line overlapped and traded in the negative trajectory. This exhibited a volatile to uncertain behavior in the token price.
The RSI further declined below the 50-level and the 14-day SMA, which showed weakness in the token’s price trend.
Disclaimer
This article is for informational purposes only and does not provide any financial, investment, or other advice. The author or any people mentioned in this article are not responsible for any financial loss that may occur from investing in or trading. Please do your research before making any financial decisions.




