
 Bitcoin
 Starknet
 Pearl
Pearl ZKsync
 NEAR Protocol
 Quantus
 Zerebro
- The Cosmos price has continuously declined over the last few months.
- ATOM price witnessed a decline in its trading activity over the last 24 hours.
The Cosmos price prediction suggested that the token’s traded volume declined by 34% in the last 24 hours from the press time. This showed a decline in the demand for the Cosmos (ATOM) token, after which the market cap declined by 1.0%.
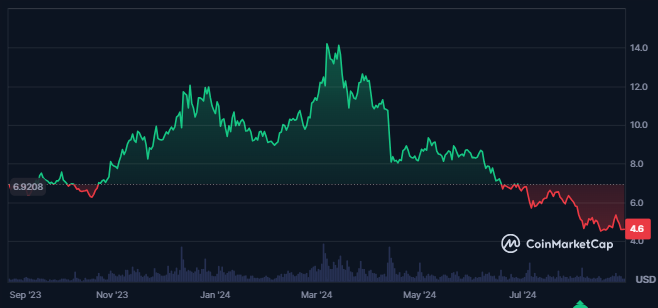
The Cosmos token price chart showed that the price declined below last year’s base. It was down by 37% at press time. This showed the sellers’ dominance in the token price in the previous 1 year.
The token’s supply inflation was undoubtedly high, resulting in 12.79%. It would act as a negative factor for the token’s investors.
At press time, the Cosmos price traded 300% above its all-time low price of $1.13. While the all-time low price was formed four years ago, the token price showed a meager advance from the bottom levels.
Despite the slow performance in price, the token had a strong market presence as it was the 44th largest cryptocurrency in the global crypto market, with a market cap dominance of 0.09%.
Let’s Take A Look At The Derivatives Data Of Cosmos Token
The token’s derivatives showed a lack of interest in traders and investors. This happened because the token’s derivatives traded volume value has declined by 47%.
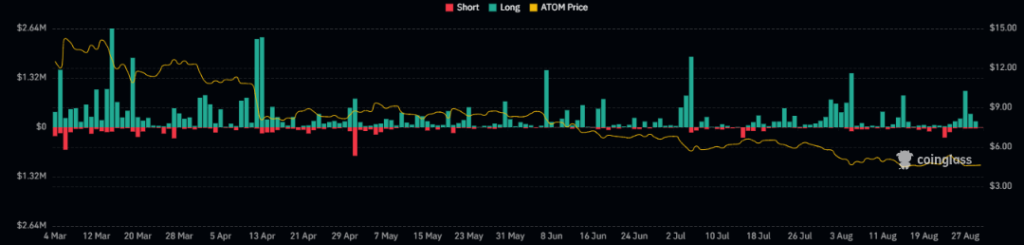
The liquidation chart showed higher long liquidations recently, indicating sellers’ dominance in the token price.
The Cosmos token’s open interest further traded flat. It has witnessed a slight decline of 0.5% in the last 24 hours from the press time.
Also, the recorded long liquidation in the previous 24 hours was worth $161.78K. At the same time, the short liquidation was valued at $29.17K.
What Does the Technical Chart Say About the ATOM Token Price?
The ATOM token has been entrenched in a sustained downtrend, primarily characterized by the development of a falling wedge pattern on the daily chart.
This bearish trend was initiated in March 2024, following the token’s ascent to a swing high of $14.5. Since reaching that peak, ATOM has been caught in a continuous decline.
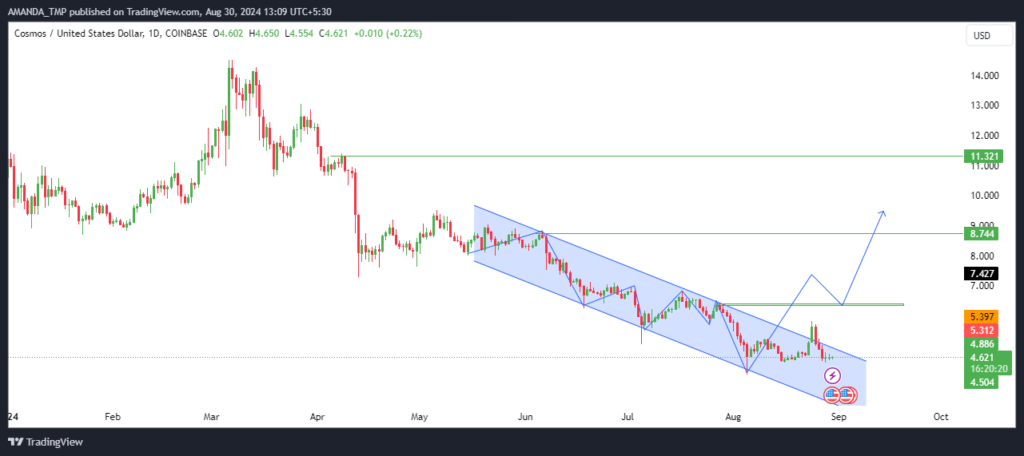
This downward trajectory has been punctuated by the formation of lower lows, further solidifying the falling wedge pattern. Over the past three months, the price has consistently traded within this pattern. It underscored the prevailing bearish sentiment in the market.
However, a significant shift could be seen on the horizon. Suppose the ATOM token breaks out of the falling wedge with strong momentum and sustains this breakout. If this happens, it could signal a potential reversal in the price trend.
Such a breakout would be a critical indicator of a transition from the prolonged bearish phase to a more bullish outlook.
What are the technical indicators of the ATOM token saying?
The ATOM token has been experiencing significant selling pressure. It was reflected by the several key technical indicators on the daily chart.
A notable signal of this bearish momentum is the death cross between the 50-day and 200-day EMAs. It has persisted for over three months.
Throughout this period, the token’s price has consistently traded below these moving averages, further confirming the negative trend.
ATOM/USD Chart by TradingView
Adding to the bearish signals, the supertrend indicator on the daily chart has issued a strong sell signal. It was accompanied by the Cosmos price remaining below the Average True Range (ATR) level. This alignment reinforced the prevailing negative market sentiment surrounding ATOM.
The MACD indicator also supports this bearish outlook. Both the MACD and signal lines have sustained a death crossover. It maintained a negative trajectory that reflects continued selling pressure in the market.
Further emphasizing the bearish sentiment, the RSI has dipped into the oversold zone, overlapping with the 14-day SMA. This convergence in the oversold territory highlighted the depth of the ATOM token’s negative sentiment.
In terms of key levels, support for the token is currently positioned at $4.00 and $4.50. In contrast, the resistance levels have been identified at $8.70 and $11.30. These levels will play a crucial role in determining the token’s near-term price action.
Disclaimer
This article is for informational purposes only and does not provide any financial, investment, or other advice. The author or any people mentioned in this article are not responsible for any financial loss that may occur from investing in or trading. Please do your research before making any financial decisions.




