
 Wisp
Wisp Doge Pepe
 Crawlerpad
 Zylo Ecosystem
 Pearl
Pearl Basic Attention
 Quantus
- Major cryptocurrencies in the global crypto market have witnessed profit bookings in recent days.
- NOT, TIA and ORDI were some of the top losers of the token in the previous week.
This week, the cryptocurrency market saw widespread profit-taking, leading to a notable price decline. As a result, many cryptocurrencies are now trading at a discount.
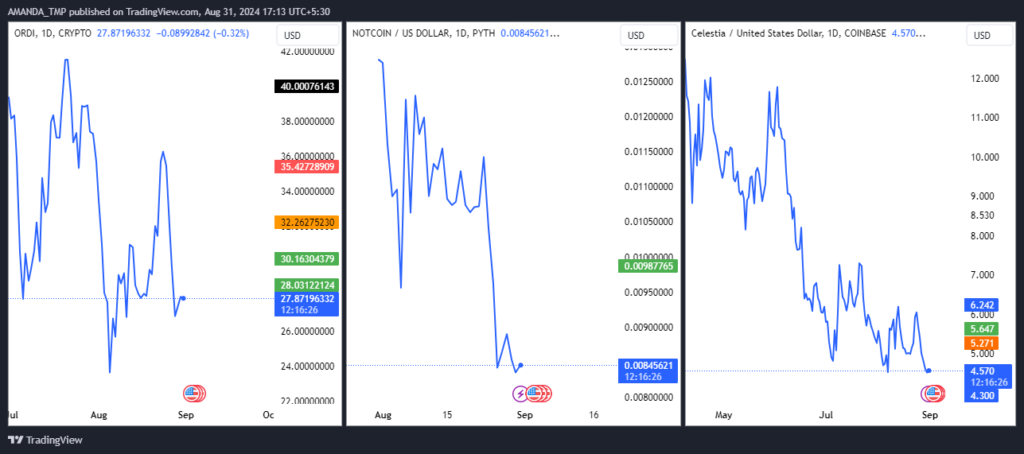
In light of these developments, it’s essential to examine the top crypto losers of the week. Also, evaluating their potential performance in the days ahead is essential.
1. Ordinals Token
Ordinals (ORDI) crypto was one of the top 100 crypto assets at the time of writing. It was followed by a market cap value of $585.134M. The token also had very good liquidity, following a volume/market cap ratio of 15.5%.
ORDI/USD Chart by TradingView.com
ORDI crypto has traded within a falling wedge pattern for the past five months. It experienced a series of declines that have pushed the token to new lows. The daily chart reflected a persistent downward trend, marked by a consistently lower low structure.
However, a potential shift in momentum could be on the horizon. Suppose the ORDI price breaks above the falling wedge and sustains this position, particularly with a significant increase in trading volume. It could indicate the start of a strong uptrend.
Such a breakout would suggest the possibility of a robust price rally in the future. It would signal a potential reversal of the current bearish trend. Investors should closely monitor this development, which could mark a pivotal moment for ORDI.
2. Notcoin Token
Notcoin (NOT) crypto price was down by 41% in the last 1 year. It had a strong security score of 85.92 at press time. The Notcoin price further joined the A tier, and its security ranking was #10, according to Certik Skynet.
NOT/USD Chart by TradingView.com
After reaching a swing high of $0.0293 on June 2, 2024, NOT underwent significant profit-taking. It resulted in a sharp 65% correction in its value. This substantial decline reflected the market’s reaction to the earlier gains and the subsequent pullback.
However, there is potential for a recovery. Suppose NOT manages to break above the key resistance level of $0.011650 and sustains this momentum. It could signal the beginning of a new upward trend.
A successful breakout and growing buyer interest may pave the way for higher price levels in the near future. Investors should watch this critical resistance level, as it could determine the next phase of NOT’s price movement.
3. Celestia Token
The Celestia (TIA) token price traded flat over the last 24 hours. A market cap of $944.375M followed it. Also, the liquidity of the TIA price was medium, as its volume/market cap ratio was 6.35%.
TIA/USD Chart by TradingView.com
The technical chart for TIA revealed a falling wedge pattern. It was characterized by a series of lower lows followed by lower highs. This pattern highlighted a steady decline in the token’s price, reflecting the development of a pronounced bearish trend over time.
Over the past five months, TIA has been subject to significant profit-taking. That resulted in a succession of bearish candlesticks on the daily chart. This persistent selling pressure suggested that the downward momentum may continue, further reinforcing the overall bearish sentiment surrounding TIA.
Disclaimer
This article is for informational purposes only and does not provide any financial, investment, or other advice. The author or any people mentioned in this article are not responsible for any financial loss that may occur from investing in or trading. Please do your research before making any financial decisions.




