
 Puffer
 ZKsync
 Bitcoin
 NEAR Protocol
 Pearl
Pearl Quantus
 Sui
Sui
- Flare crypto has witnessed only long liquidations over the last 24 hours.
- The FLR crypto price was outperformed by 57% of the top 100 crypto assets in the last 1 year.
For a while, the Flare (FLR) price traded in a strong downtrend, leading to the lower low swing on the chart. However, the recent price action showed that the token was on the brink of a breakout above significant levels.
Yet, despite this movement, the FLR price lacked volume and momentum. Let’s explore: Will the token get a magic stick and skyrocket soon, or has the breakout failed?
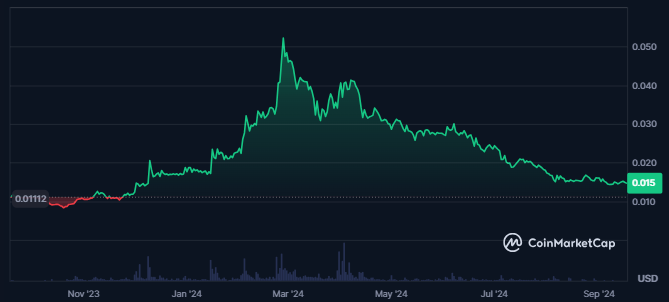
FLR Price And Market Activity: Mixed Signals and Growing TVL
The FLR price has experienced a relatively static market cap over the past 24 hours. This was increased by a modest increase of 0.55%, bringing the total market cap to $711.565 Million. However, the traded volume for Flare has seen a decline of 11.6%, reflecting a decrease in market activity.
According to CoinMarketCap, Flare is currently ranked #81 in terms of market capitalization. The volume-to-market cap ratio stood at 0.35%, indicating low token liquidity. This low liquidity can make it challenging for traders to enter and exit positions in the market efficiently.
On a positive note, Flare Crypto‘s Total Value Locked (TVL) has recently risen to $15.94 Million. This increase highlighted growing confidence in the project’s fundamentals. It happened as more capital was being staked within the protocol, reinforcing the token’s underlying strength.
Flare Crypto Witnesses Strong Sellers’ Dominance
Open interest for Flare has increased by 4.94% over the past 24 hours. It indicated a rise in the number of positions taken on the token. This suggested growing trader engagement and interest in the market.
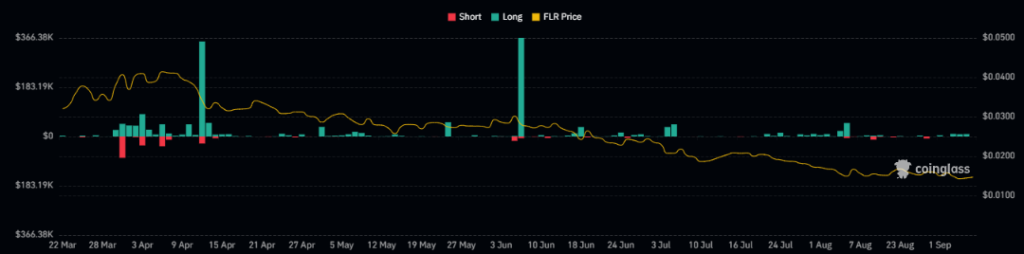
Long liquidations for Flare were recorded at $9.07 Million, while short liquidations remained at zero. This highlighted bearish dominance in the market, as sellers have controlled the price action over the last day.
The spot trading volume for Flare Crypto has slightly declined. In contrast, the derivatives trading volume surged by 5.7% in the same period, reaching a traded value of $1.34 Million. This uptick in derivatives activity signaled heightened interest in leveraged positions despite the overall decrease in spot trading.
Let’s Dive Deeper Into The Technical Price Chart Of FLR Token
The Flare has recently experienced significant profit-taking. It resulted in a FLR price decline of over 60% from its swing high of $0.056. This sustained downward movement has weighed heavily on the token’s value.
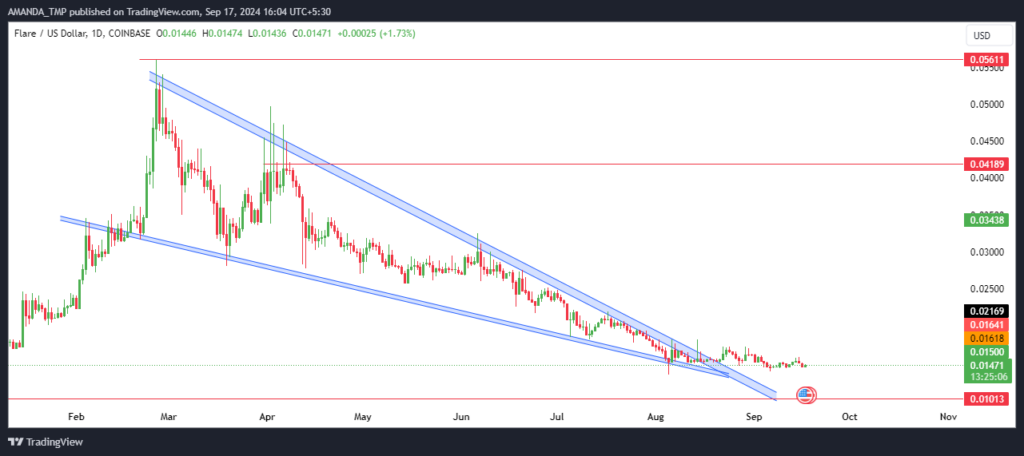
Over the past four months, the Flare price has consistently declined. This led to a falling wedge pattern on the daily chart. Such a pattern often suggested a potential reversal; however, the breakout above the wedge failed to gain momentum.
Despite breaking out from the falling wedge, the FLR price lacked bullish support. The insufficient trading volume further hindered the potential for a strong upward move. It reflected the current market uncertainty surrounding FLR.
What Do Technical Indicators On the Flare Crypto Technical Chart Indicate?
The 50-day and 200-day EMAs have traded in a death cross, a bearish signal pushing the FLR price below these key EMAs. This pattern confirmed the ongoing bearish trend in the cryptocurrency’s market performance.
FLR/USD Chart by TradingView.com
The Flare crypto price must break above the 50-day and 200-day EMAs for any signs of a potential reversal. Additionally, it has to secure a closing above these levels. A sustained move above these EMAs would be a key indicator of a shift in market sentiment.
The MACD continued to trade on a negative trajectory. It was followed by the MACD and the signal line in a death cross formation, further signaling weakness in price momentum.
Additionally, the RSI has fallen below the critical 50 level and has overlapped with the 14-day SMA. This has reinforced the bearish momentum.
Support levels for FLR were currently at $0.0080 and $0.010, while resistance was expected at $0.0320 and $0.0410. These levels will be crucial in determining the next move for the token.
Disclaimer
This article is for informational purposes only and does not provide any financial, investment, or other advice. The author or any people mentioned in this article are not responsible for any financial loss that may occur from investing in or trading. Please do your research before making any financial decisions.




