Pearl
Pearl Bitway
 Pudgy Penguins
 Optimism
 Walrus
 NEAR Protocol
 Pons
Pons
- DOT crypto hovers around the 50-day EMA and aims for a breakout.
- Positive funding rate and rising OI represented a surge in demand.
Polkadot (DOT) price has risen over 6% in the past week and was edging closer to a falling wedge breakout. The DOT price has hovered in a tight range over the past two months. This week, fresh accumulation was noted, and the price rebounded from range lows, which gives a bullish conviction.
The Polkadot price action indicates that the bulls want to cross the $5 level. However, bulls failed to surpass the hurdles due to lacking buying momentum. Data from Messari indicated that DOT’s Sharpe Ratio turned positive at 0.06. This means that the current risk-to-reward ratio is good.
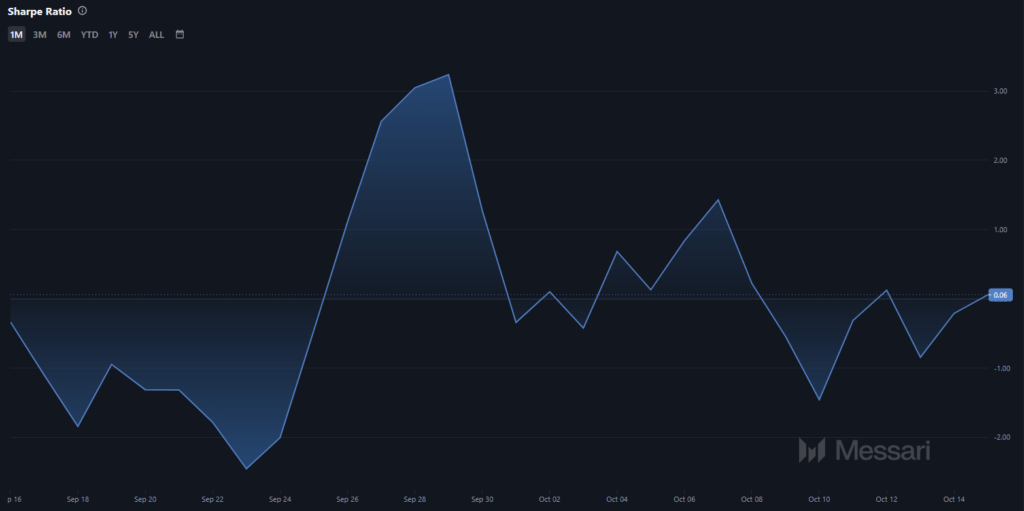
It pointed out that the altcoin has a higher chance of producing a positive return. Hence, the probability of a falling wedge breakout is high. A daily close above the $5 trendline barrier would validate the breakout, and it could see a 10-15% rise in the near sessions.
Crypto Analysts Over DOT Price Performance
CryptoBull, in his recent tweet, highlighted that the DOT crypto has bounced off from the value area and is gaining momentum. The positioning of crypto suggested that there could be a massive breakout in the following sessions.
Additionally, Crypto Analyst Ali Martinez said that the DOT price may follow the footsteps of FTM. He mentioned that FTM crypto bounced off from the range lows and outperformed in recent sessions.
DOT crypto painted a similar picture to FTM, and he was expecting that Polkadot might experience a short-term rise ahead.
DOT Price Prediction: Is $5 Breakout Imminent?
The DOT price action on a daily chart indicated that buyers are trying to set their upper hand and aim for a breakout. Recent accumulation from lower levels signaled demand resurgence and growing investor interest.
The DOT crypto price climbed above the 20-day and 50-day EMA clusters. It has aimed to cross the 100-day EMA mark for a successful breakout. At press time, DOT crypto was trading at $4.40 with an intraday rise of over 2.20%.
Per the Fib levels, it was trading above the 23.6% zone and edging closer to the 38.2% barrier, around the $5 mark.
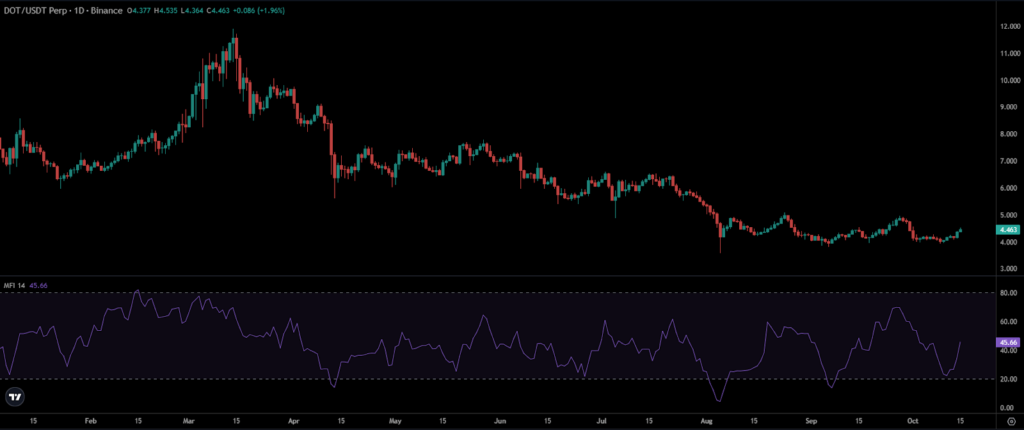
Furthermore, the Money Flow Index (MFI) value surged to 45. This signaled increased inflows in the market, suggesting a positive market interest.
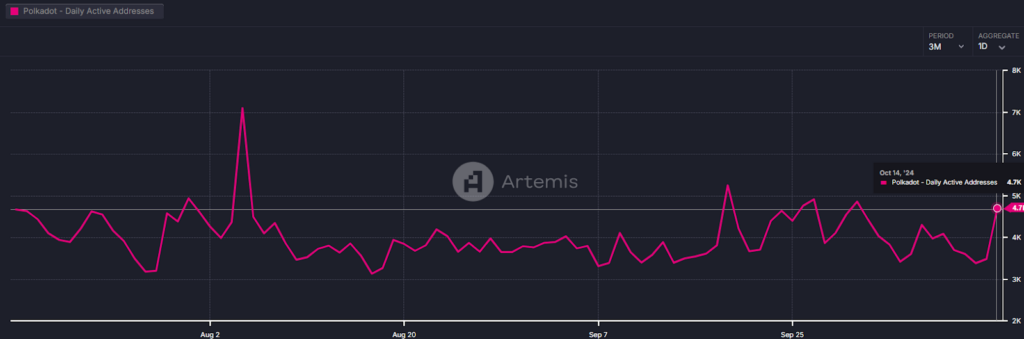
The daily active addresses noted a vertical spike. At press time, more than 4.7k addresses are active on-chain, and a rise of over 25% in the last three sessions was reported. This growth in addresses highlighted the growing investor interest and demand for Polkadot.
Futures Market Data Display Bullish Optimism
Data from Coinglass showed that the OI-weighted funding rate remained positive for the past two weeks. It means a sustained demand for the long positions. At press time, the funding rate value was at 0.0123%.
Alongside the weekly rise of over 6% in DOT price, the Open Interest (OI) has risen over 8.27% to $237.52 million. This conveyed a prolonged build-up activity.
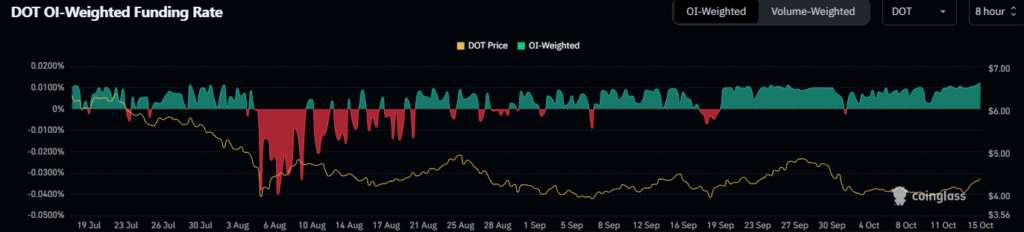
That means buyers hope for a price rise and will continue adding long positions. The immediate support zones for DOT crypto were $4.20 and $3.80. At the same time, the resistance levels were $5 and $5.80 to watch out for the following sessions.
Disclaimer
This article is for informational purposes only and provides no financial, investment, or other advice. The author or any people mentioned in this article are not responsible for any financial loss that may occur from investing in or trading. Please do your research before making any financial decisions.