Dacity Coin
 streamoors
 astronaut
 Injective
 Celestia
 Pudgy Penguins
 Sui
Sui
- The TIA price experienced a 10% intraday surge, demonstrating strong support from the 20-day and 50-day EMA bands.
- Some analysts are concerned that the upcoming token unlocks on October 30 might negatively affect TIA’s price. However, many remain hopeful.
- Analyst @cryptoknight890 suggested that TIA might encounter resistance at the $7-$8 range in the short term. It has the potential to reach its yearly high with continued momentum.
Celestia (TIA) has shown impressive performances this week. It quickly returned from the early October dip. Crypto is now at the forefront of the crypto market’s recovery, as shown on the daily chart. It indicated a potential continuation of its bullish trend through the end of the month.
Over the past two weeks, TIA price‘s strong momentum has brought its price close to the 200-day EMA band. It has effortlessly surpassed the 20-day and 50-day EMA bands, which now provide dynamic support for its price.
TIA crypto has garnered significant attention with a 10% intraday surge, pushing its value above $6. This surge is fueled by Bitcoin‘s bullish sentiment and the recent Shwap upgrade. It boasted 12x faster DA sampling. These developments have made TIA one of the day’s top cryptocurrency gainers.
Read on to discover whether TIA’s price can continue its upward trajectory or if there are potential obstacles ahead.
How Was 2024 So Far For Celestia Price On the Daily Chart?
In Q1 2024, TIA price saw remarkable gains of over 810% on the daily chart. However, profit-taking created a supply zone, leading to a significant sell-off and a declining wedge pattern. The price remained within this narrowing range for 215 days.
This sell-off pushed TIA into a downtrend after reaching its all-time high (ATH) in March. It resulted in an 80% correction from $20 to $4 over the past 215 days. Even September’s retracement dragged TIA below $4, marking its lowest price since early November 2023.
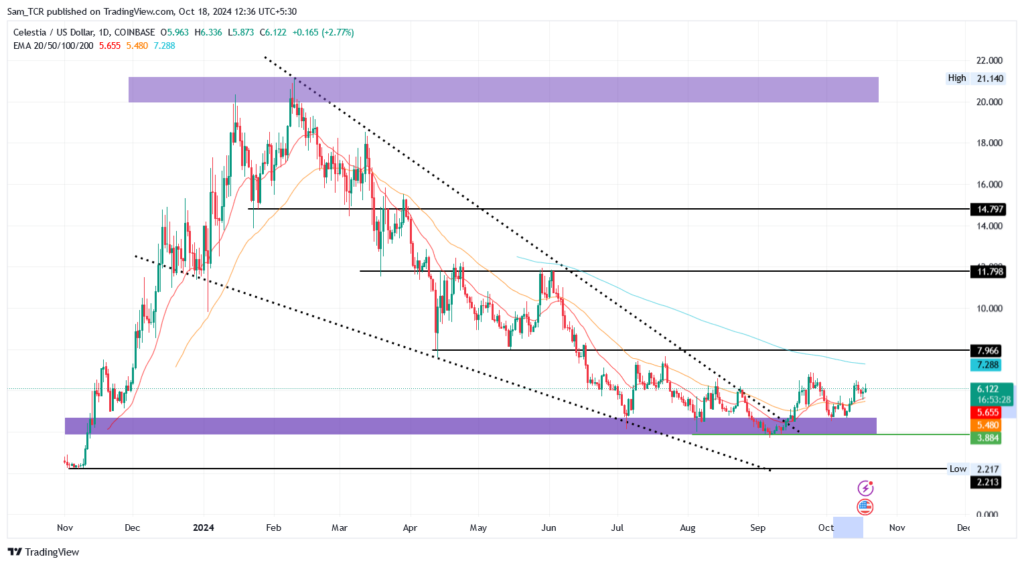
At this low, selling pressure weakened, and TIA found strong support at $3.884, a level it has held since July. Increased bullish activity from mid-September broke through the upper boundary of the falling wedge.
However, the bullish breakout was weak by late September, leading to another retracement in early October. The TIA price then consolidated below the 20-day and 50-day EMA bands until October 10.
From October 11 onwards, bullish sentiment reignited as investors viewed Celestia‘s on-chain developments as a positive sign. Since then, TIA has seen a 36% monthly increase, boosting community optimism.
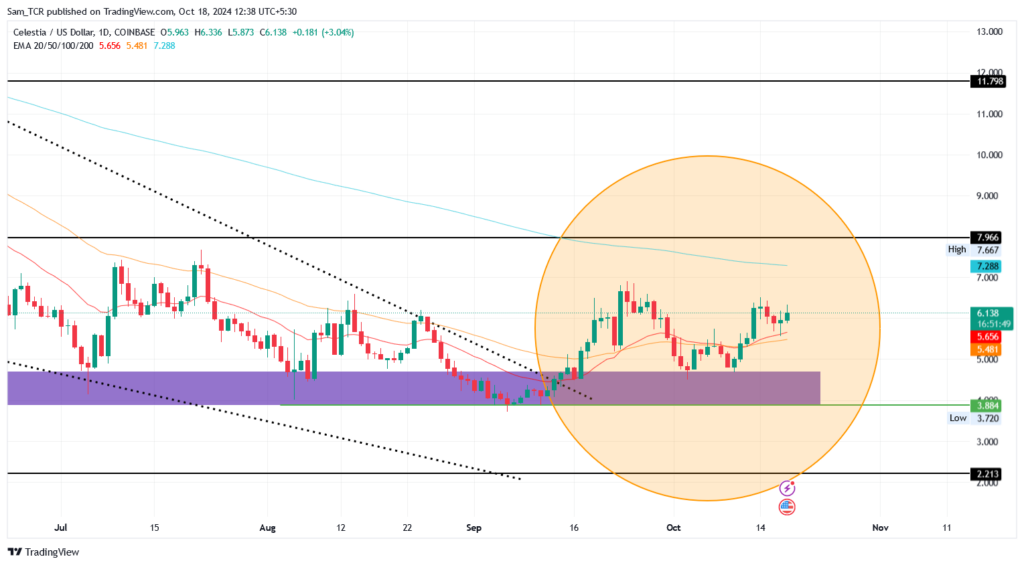
Today, TIA crypto surged 10% intraday, showing dynamic support from the 20-day and 50-day EMA bands. This performance has made Celestia one of the top gainers among the top 100 cryptocurrencies by market capitalization.
Would Token Unlocks This Month Hinder TIA Price Potential?
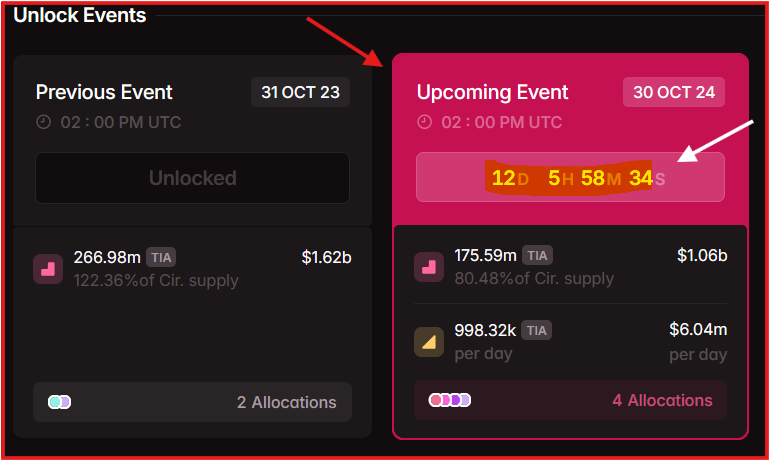
Some analysts believe the upcoming token unlocks starting on October 30 could negatively impact the TIA price. However, many remain optimistic.
This optimism is driven by recent ecosystem and on-chain developments that highlight the project’s robust efforts.
Additionally, TIA crypto boasted strong fundamentals. It has attracted significant investments from prominent industry backers. The announcement of an additional $155 Million in funding in late September has further strengthened TIA’s fundamentals.
Nearly two weeks have remained until the next token unlock date. There is still a strong possibility of a rally or parabolic move before the unlock occurs.
Therefore, close monitoring is essential, and investors should avoid FOMO and conduct their own research.
Analysts Think A Big Move Coming For TIA Price, In Both Short & Long-Term?
Several market analysts are closely watching Celestia’s performance. Per their TIA price prediction, the cryptocurrency’s chart indicated a potential for a breakout ahead.
According to crypto analyst @AltcoinSherpa, the price could reach the $7-$8 resistance zone in the short term.
@AltcoinSherpa X post states:-
- ”having a lot of discussions w. my friends on $TIA lately. I think that it looks pretty good in the short term and could go up to $7ish (or even higher). I’m still extremely apprehensive about the sell pressure, though- you’re basically hoping that these investors will put a pause on it OR straight demand can overcome it. Hard to say where this lands in the longer term (I think much lower tbh).”
However, @AltcoinSherpa expresses some caution. He has noted that a Change of Character (ChoCh) is still needed for long-term trend sustainability.
In contrast, other analysts are more optimistic about recent on-chain developments. For instance, @cryptoknight890 believes that the price may hit the $7-$8 resistance in the short term. With a proper pullback formation, it could reach its yearly high of $20-$22 in the long term.
Renowned analysts like @WorldOfCharts1 and @CryptoPoseidonn also believe in the potential of the TIA price. Both have predicted higher prices in both the short and long term.
World Of Charts @WorldOfCharts1 X post states:-
“#Tia Showing Strength & Trying To Clear Consolidation Range Again & Again Expecting Successful Breakout Soon Breakout Can Send Tia Towards New Ath In Coming Weeks”
Poseidon @CryptoPoseidonn X post states:- ”$TIA The trend shift has happened, now the chart needs an expansion candle. Send it.”
Overall, the sentiment within the community and among investors appears optimistic. Most analysts are confident about the short-term trend. However, some remain cautious due to the pending ChoCh, which affects complete confidence.
Based on the daily chart, once the ChoCh is confirmed, long-term targets could approach the yearly highs.
Spot & Derivatives Data signify Optimism in TIA Price
TIA’s price and market cap have seen significant improvements in October. The market cap has risen from a monthly low of $999.4 Million to $1.33 Billion. TIA’s rank has climbed to 56th based on intraday numbers.
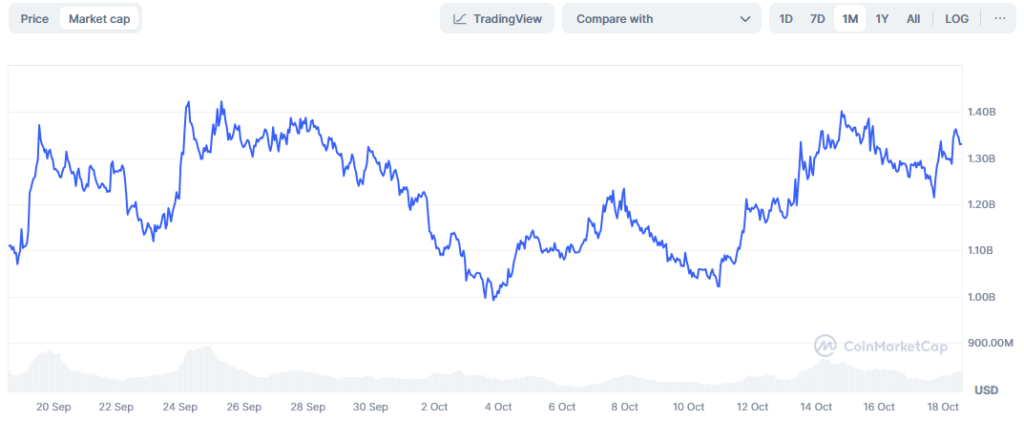
Spot volume inflow has surged by over 70.61%, reaching $169.58 Million, driven by several optimistic factors. This increase in liquidity has facilitated smoother trading activities.
In the derivatives market, demand has also grown. According to Coinglass, TIA Crypto‘s open interest has increased by 11.57% from the previous session, reaching $294.76 Million. This rise in open contracts indicates higher intraday demand.
The derivatives volume surged by 72.45%, bringing the total traded value to $832.05 Million. This increase reflects the growing demand for Celestia crypto in the derivatives market.
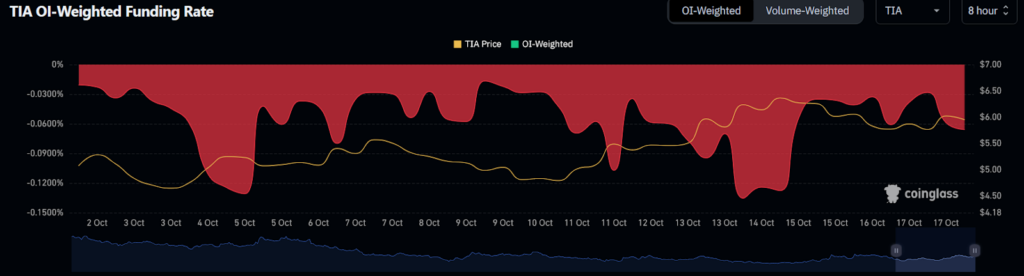
These metrics highlight a bullish intraday sentiment for TIA, confirming the recent price surge. Additionally, the OI-weighted funding rate indicated a decline in bearish dominance. It hinted at increased buyer interest and a potential for an upward TIA price trend.
Disclaimer
In this article, the views, and opinions stated by the author, or any people named are for informational purposes only, and they don’t establish the investment, financial, or any other advice. Trading or investing in cryptocurrency assets comes with a risk of financial loss.